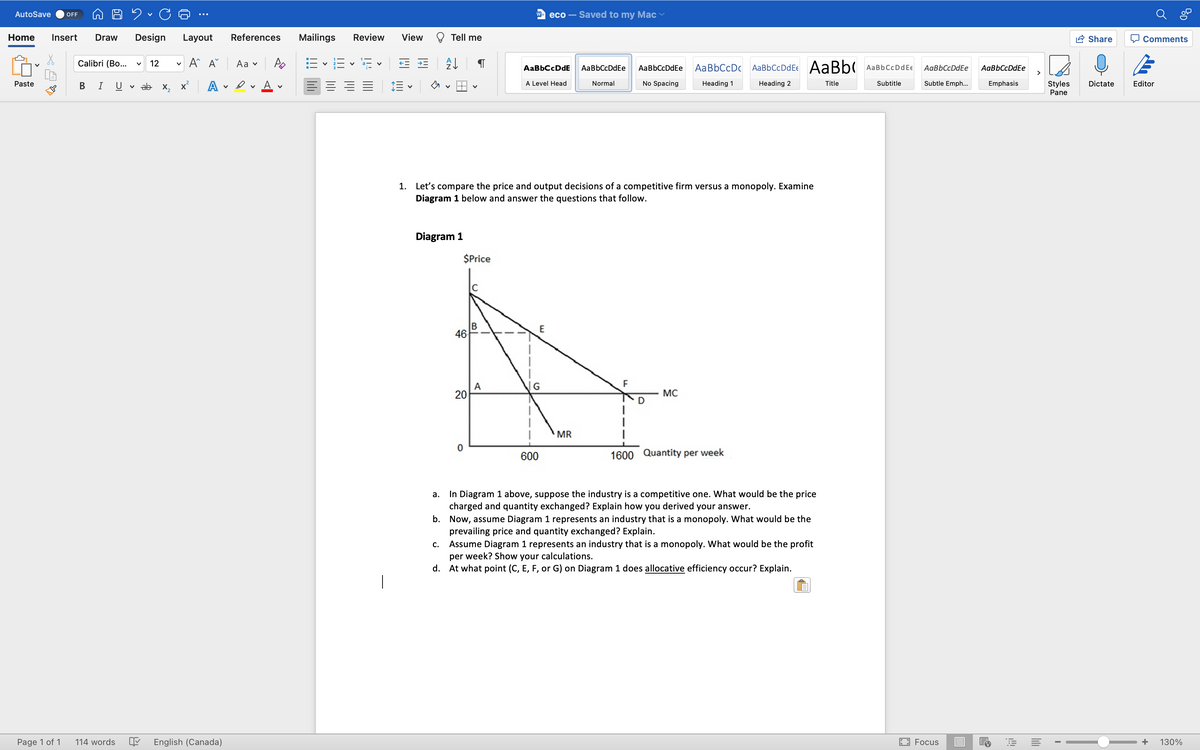
1. Let's compare the price and output decisions of a competitive firm versus a monopoly. Examine Diagram 1 below and answer the questions that follow. Diagram 1 $Price 46 20 MC D MR 600 1600 Quantity per week a. In Diagram 1 above, suppose the industry is a competitive one. What would be the price charged and quantity exchanged? Explain how you derived your answer. b. Now, assume Diagram 1 represents an industry that is a monopoly. What would be the prevailing price and quantity exchanged? Explain. c. Assume Diagram 1 represents an industry that is a monopoly. What would be the profit per week? Show your calculations. d. At what point (C, E, F, or G) on Diagram 1 does allocative efficiency occur? Explain. | English (Canada) E Focus O E E -
1. Let's compare the price and output decisions of a competitive firm versus a monopoly. Examine Diagram 1 below and answer the questions that follow. Diagram 1 $Price 46 20 MC D MR 600 1600 Quantity per week a. In Diagram 1 above, suppose the industry is a competitive one. What would be the price charged and quantity exchanged? Explain how you derived your answer. b. Now, assume Diagram 1 represents an industry that is a monopoly. What would be the prevailing price and quantity exchanged? Explain. c. Assume Diagram 1 represents an industry that is a monopoly. What would be the profit per week? Show your calculations. d. At what point (C, E, F, or G) on Diagram 1 does allocative efficiency occur? Explain. | English (Canada) E Focus O E E -

Principles of Microeconomics
7th Edition
ISBN:9781305156050
Author:N. Gregory Mankiw
Publisher:N. Gregory Mankiw
Chapter22: Frontiers Of Microeconomics
Section: Chapter Questions
Problem 6PA

Related questions
Question
100%
how to work problems
Transcribed Image Text:AutoSave
W eco
Saved to my Mac v
OFF
Home
Insert
Draw
Design
Layout
References
Mailings
Review
View
Tell me
A Share
O Comments
Calibri (Bo...
A A
Аa v
E vE v E v E E
12
AaBbCcDc
AaBbCcDdEe AaBb(
AaBbCcDdE
АаBbCcDdEe
AaBbCcDdEe
AaBbCcDdEE
АаBbСcDdEe
AaBbCcDdEe
>
E = = =
A
A
A Level Head
No Spacing
Title
Subtle Emph...
Emphasis
Styles
Paste
U
v ab x, x
Normal
Heading 1
Heading 2
Subtitle
Dictate
Editor
Pane
1. Let's compare the price and output decisions of a competitive firm versus a monopoly. Examine
Diagram 1 below and answer the questions that follow.
Diagram 1
$Price
46
A
MC
MR
600
1600 Quantity per week
In Diagram 1 above, suppose the industry is a competitive one. What would be the price
charged and quantity exchanged? Explain how you derived your answer.
b. Now, assume Diagram 1 represents an industry that is a monopoly. What would be the
prevailing price and quantity exchanged? Explain.
Assume Diagram 1 represents an industry that is a monopoly. What would be the profit
per week? Show your calculations.
d. At what point (C, E, F, or G) on Diagram 1 does allocative efficiency occur? Explain.
а.
с.
Page 1 of 1
114 words
English (Canada)
Focus
+
130%
20
Expert Solution
This question has been solved!
Explore an expertly crafted, step-by-step solution for a thorough understanding of key concepts.

Step by step
Solved in 2 steps

Knowledge Booster


Learn more about
Need a deep-dive on the concept behind this application? Look no further. Learn more about this topic, economics and related others by exploring similar questions and additional content below.Recommended textbooks for you
Principles of Microeconomics
Economics
ISBN:
9781305156050
Author:
N. Gregory Mankiw
Publisher:
Cengage Learning

Principles of Economics 2e
Economics
ISBN:
9781947172364
Author:
Steven A. Greenlaw; David Shapiro
Publisher:
OpenStax
Principles of Microeconomics
Economics
ISBN:
9781305156050
Author:
N. Gregory Mankiw
Publisher:
Cengage Learning
Principles of Economics 2e
Economics
ISBN:
9781947172364
Author:
Steven A. Greenlaw; David Shapiro
Publisher:
OpenStax