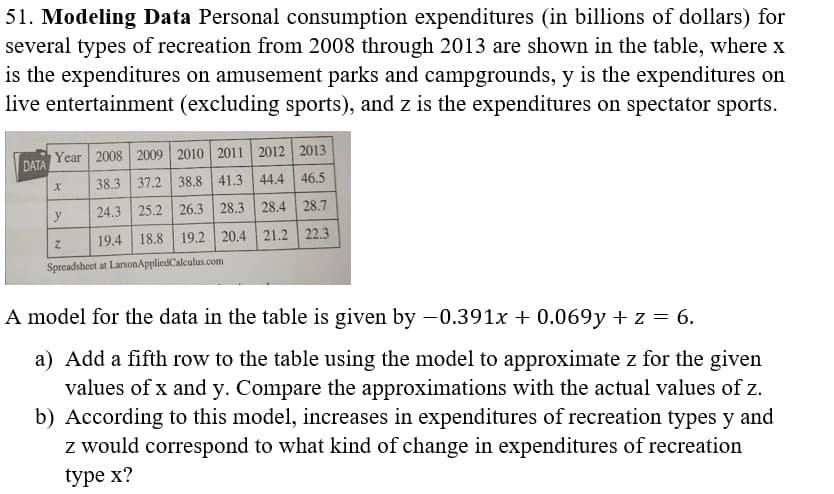
1. Modeling Data Personal consumption expenditures (in billions of dollars) for everal types of recreation from 2008 through 2013 are shown in the table, where x s the expenditures on amusement parks and campgrounds, y is the expenditures on ive entertainment (excluding sports), and z is the expenditures on spectator sports.

Big Ideas Math A Bridge To Success Algebra 1: Student Edition 2015
1st Edition
ISBN:9781680331141
Author:HOUGHTON MIFFLIN HARCOURT
Publisher:HOUGHTON MIFFLIN HARCOURT
Chapter2: Solving Linear Inequalities
Section2.2: Solving Inequalities Using Addition Or Substraction
Problem 40E
icon
Related questions
icon
Concept explainers
Topic Video
Question
51. Modeling Data Personal consumption expenditures (in billions of dollars) for
several types of recreation from 2008 through 2013 are shown in the table, where x
is the expenditures on amusement parks and campgrounds, y is the expenditures on
live entertainment (excluding sports), and z is the expenditures on spectator sports.
Year 2008 2009 2010 2011 | 2012 2013
DATA
38.3 37.2 38.8 41.3 44.4 46.5
24.3 25.2 26.3 28.3 28.4 28.7
19.4 18.8 19.2 20.4 21.2 22.3
Spreadsheet at LarsonAppliedCalculus.com
A model for the data in the table is given by –0.391x + 0.069y +z = 6.
a) Add a fifth row to the table using the model to approximate z for the given
values of x and y. Compare the approximations with the actual values of z.
b) According to this model, increases in expenditures of recreation types y and
z would correspond to what kind of change in expenditures of recreation
type x?
Transcribed Image Text:51. Modeling Data Personal consumption expenditures (in billions of dollars) for several types of recreation from 2008 through 2013 are shown in the table, where x is the expenditures on amusement parks and campgrounds, y is the expenditures on live entertainment (excluding sports), and z is the expenditures on spectator sports. Year 2008 2009 2010 2011 | 2012 2013 DATA 38.3 37.2 38.8 41.3 44.4 46.5 24.3 25.2 26.3 28.3 28.4 28.7 19.4 18.8 19.2 20.4 21.2 22.3 Spreadsheet at LarsonAppliedCalculus.com A model for the data in the table is given by –0.391x + 0.069y +z = 6. a) Add a fifth row to the table using the model to approximate z for the given values of x and y. Compare the approximations with the actual values of z. b) According to this model, increases in expenditures of recreation types y and z would correspond to what kind of change in expenditures of recreation type x?
Expert Solution
steps

Step by step

Solved in 3 steps

Blurred answer
Knowledge Booster
Centre, Spread, and Shape of a Distribution
Learn more about
Need a deep-dive on the concept behind this application? Look no further. Learn more about this topic, advanced-math and related others by exploring similar questions and additional content below.
Recommended textbooks for you
Big Ideas Math A Bridge To Success Algebra 1: Stu…
Algebra
ISBN:
9781680331141
Author:
HOUGHTON MIFFLIN HARCOURT
Publisher:
Houghton Mifflin Harcourt