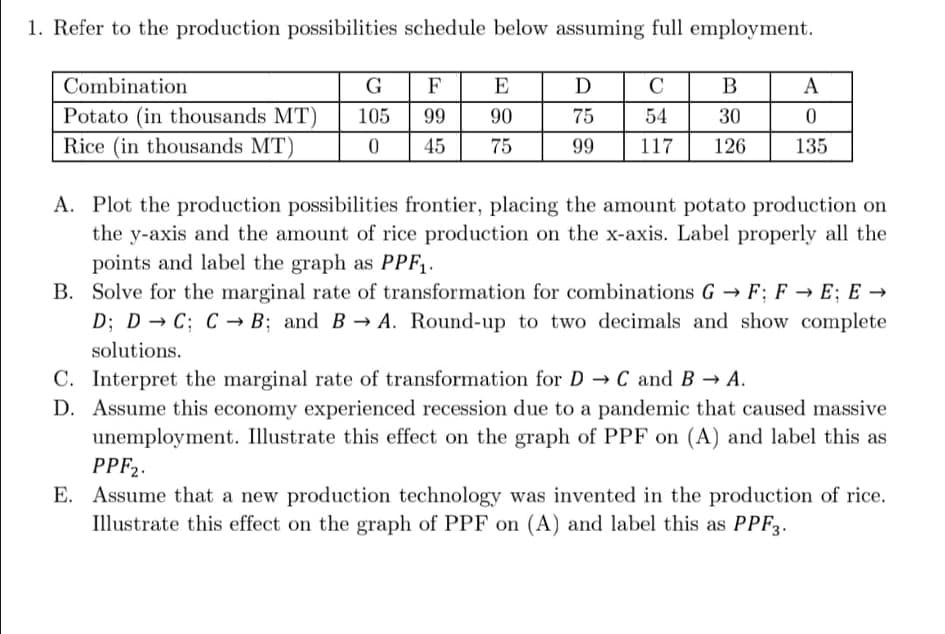
1. Refer to the production possibilities schedule below assuming full employment. Combination G F E D C B A Potato (in thousands MT) 105 99 90 75 54 30 Rice (in thousands MT) 45 75 99 117 126 135 A. Plot the production possibilities frontier, placing the amount potato production on the y-axis and the amount of rice production on the x-axis. Label properly all the points and label the graph as PPF,. B. Solve for the marginal rate of transformation for combinations G→ F; F → E; E → D; D → C; C→ B; and B A. Round-up to two decimals and show complete solutions. C. Interpret the marginal rate of transformation for D C and B A.
1. Refer to the production possibilities schedule below assuming full employment. Combination G F E D C B A Potato (in thousands MT) 105 99 90 75 54 30 Rice (in thousands MT) 45 75 99 117 126 135 A. Plot the production possibilities frontier, placing the amount potato production on the y-axis and the amount of rice production on the x-axis. Label properly all the points and label the graph as PPF,. B. Solve for the marginal rate of transformation for combinations G→ F; F → E; E → D; D → C; C→ B; and B A. Round-up to two decimals and show complete solutions. C. Interpret the marginal rate of transformation for D C and B A.
Managerial Economics: Applications, Strategies and Tactics (MindTap Course List)
14th Edition
ISBN:9781305506381
Author:James R. McGuigan, R. Charles Moyer, Frederick H.deB. Harris
Publisher:James R. McGuigan, R. Charles Moyer, Frederick H.deB. Harris
Chapter2: Fundamental Economic Concepts
Section: Chapter Questions
Problem 1E: For each of the determinants of demand in Equation 2.1, identify an example illustrating the effect...
Related questions
Question
Hello! Can someone please help me with this one? My first question is answered yet it is incomplete. Please help me with this one, our professors aren't providing enough lectures and I do not understand how I could compute it. Please help me, with the full computation and solution. Thank you! I really appreciate it! Please help me I am begging you, sir/ma'am.

Transcribed Image Text:1. Refer to the production possibilities schedule below assuming full employment.
Combination
G F
E
D
C
B
A
Potato (in thousands MT)
105
99
90
75
54
30
Rice (in thousands MT)
45
75
99
117
126
135
A. Plot the production possibilities frontier, placing the amount potato production on
the y-axis and the amount of rice production on the x-axis. Label properly all the
points and label the graph as PPF1.
B. Solve for the marginal rate of transformation for combinations G → F; F → E; E →
D; D → C; C → B; and B→ A. Round-up to two decimals and show complete
solutions.
C. Interpret the marginal rate of transformation for D C and B → A.
D. Assume this economy experienced recession due to a pandemic that caused massive
unemployment. Illustrate this effect on the graph of PPF on (A) and label this as
PPF2.
E. Assume that a new production technology was invented in the production of rice.
Illustrate this effect on the graph of PPF on (A) and label this as PPF3.

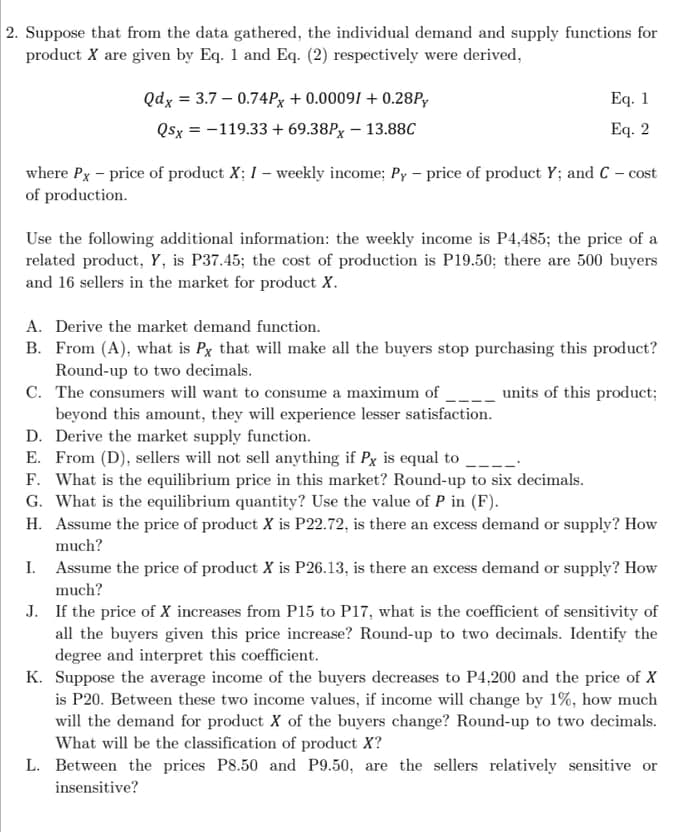
Transcribed Image Text:2. Suppose that from the data gathered, the individual demand and supply functions for
product X are given by Eq. 1 and Eq. (2) respectively were derived,
Qdx = 3.7 – 0.74PX + 0.00091 + 0.28P,
Eq. 1
Qsx = -119.33 + 69.38P, – 13.88C
Eq. 2
%3D
where Px - price of product X; I – weekly income; Py - price of product Y; and C - cost
of production.
Use the following additional information: the weekly income is P4,485; the price of a
related product, Y, is P37.45; the cost of production is P19.50; there are 500 buyers
and 16 sellers in the market for product X.
A. Derive the market demand function.
B. From (A), what is Px that will make all the buyers stop purchasing this product?
Round-up to two decimals.
C. The consumers will want to consume a maximum of
beyond this amount, they will experience lesser satisfaction.
D. Derive the market supply function.
E. From (D), sellers will not sell anything if Px is equal to
F. What is the equilibrium price in this market? Round-up to six decimals.
G. What is the equilibrium quantity? Use the value of P in (F).
units of this product;
H. Assume the price of product X is P22.72, is there an excess demand or supply? How
much?
I. Assume the price of product X is P26.13, is there an excess demand or supply? How
much?
J. If the price of X increases from P15 to P17, what is the coefficient of sensitivity of
all the buyers given this price increase? Round-up to two decimals. Identify the
degree and interpret this coefficient.
K. Suppose the average income of the buyers decreases to P4,200 and the price of X
is P20. Between these two income values, if income will change by 1%, how much
will the demand for product X of the buyers change? Round-up to two decimals.
What will be the classification of product X?
L. Between the prices P8.50 and P9.50, are the sellers relatively sensitive or
insensitive?
Expert Solution
This question has been solved!
Explore an expertly crafted, step-by-step solution for a thorough understanding of key concepts.
Step by step
Solved in 5 steps with 2 images

Recommended textbooks for you

Managerial Economics: Applications, Strategies an…
Economics
ISBN:
9781305506381
Author:
James R. McGuigan, R. Charles Moyer, Frederick H.deB. Harris
Publisher:
Cengage Learning

Managerial Economics: Applications, Strategies an…
Economics
ISBN:
9781305506381
Author:
James R. McGuigan, R. Charles Moyer, Frederick H.deB. Harris
Publisher:
Cengage Learning