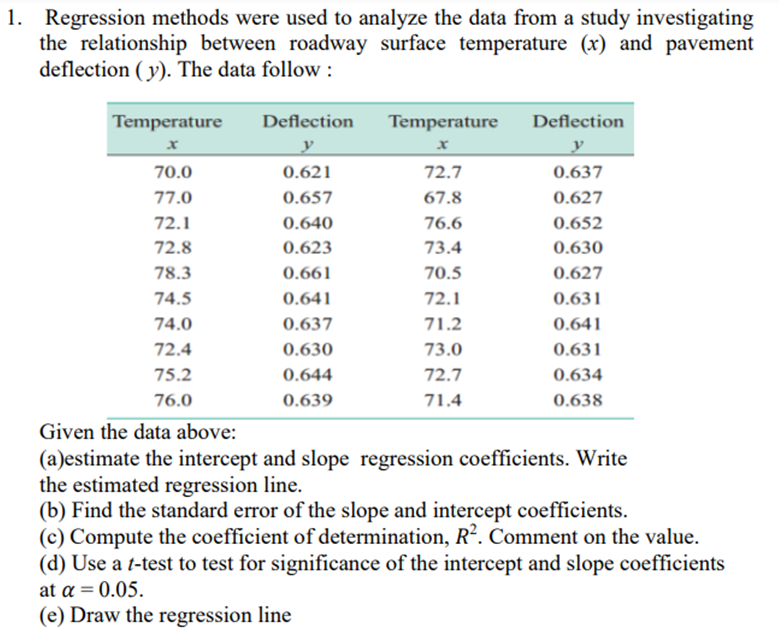
1. Regression methods were used to analyze the data from a study investigating the relationship between roadway surface temperature (x) and pavement deflection ( y). The data follow : Temperature Deflection Temperature Deflection 70.0 0.621 72.7 0.637 77.0 0.657 67.8 0.627 72.1 0.640 76.6 0.652 72.8 0.623 73.4 0.630 78.3 0.661 70.5 0.627 74.5 0.641 72.1 0.631 74.0 0.637 71.2 0.641 72.4 0.630 73.0 0.631 75.2 0.644 72.7 0.634 76.0 0.639 71.4 0.638 Given the data above: (a)estimate the intercept and slope regression coefficients. Write the estimated regression line. (b) Find the standard error of the slope and intercept coefficients. (c) Compute the coefficient of determination, R². Comment on the value. (d) Use a t-test to test for significance of the intercept and slope coefficients at a = 0.05. (e) Draw the regression line
1. Regression methods were used to analyze the data from a study investigating the relationship between roadway surface temperature (x) and pavement deflection ( y). The data follow : Temperature Deflection Temperature Deflection 70.0 0.621 72.7 0.637 77.0 0.657 67.8 0.627 72.1 0.640 76.6 0.652 72.8 0.623 73.4 0.630 78.3 0.661 70.5 0.627 74.5 0.641 72.1 0.631 74.0 0.637 71.2 0.641 72.4 0.630 73.0 0.631 75.2 0.644 72.7 0.634 76.0 0.639 71.4 0.638 Given the data above: (a)estimate the intercept and slope regression coefficients. Write the estimated regression line. (b) Find the standard error of the slope and intercept coefficients. (c) Compute the coefficient of determination, R². Comment on the value. (d) Use a t-test to test for significance of the intercept and slope coefficients at a = 0.05. (e) Draw the regression line

College Algebra
7th Edition
ISBN:9781305115545
Author:James Stewart, Lothar Redlin, Saleem Watson
Publisher:James Stewart, Lothar Redlin, Saleem Watson
Chapter1: Equations And Graphs
Section: Chapter Questions
Problem 10T: Olympic Pole Vault The graph in Figure 7 indicates that in recent years the winning Olympic men’s...

Related questions
Question
Transcribed Image Text:1. Regression methods were used to analyze the data from a study investigating
the relationship between roadway surface temperature (x) and pavement
deflection ( y). The data follow :
Temperature
Deflection
Temperature
Deflection
y
y
70.0
0.621
72.7
0.637
77.0
0.657
67.8
0.627
72.1
0.640
76.6
0.652
72.8
0.623
73.4
0.630
78.3
0.661
70.5
0.627
74.5
0.641
72.1
0.631
74.0
0.637
71.2
0.641
72.4
0.630
73.0
0.631
75.2
0.644
72.7
0.634
76.0
0.639
71.4
0.638
Given the data above:
(a)estimate the intercept and slope regression coefficients. Write
the estimated regression line.
(b) Find the standard error of the slope and intercept coefficients.
(c) Compute the coefficient of determination, R². Comment on the value.
(d) Use a t-test to test for significance of the intercept and slope coefficients
at a = 0.05.
(e) Draw the regression line
Expert Solution
This question has been solved!
Explore an expertly crafted, step-by-step solution for a thorough understanding of key concepts.

This is a popular solution!

Trending now
This is a popular solution!

Step by step
Solved in 5 steps with 4 images

Recommended textbooks for you
College Algebra
Algebra
ISBN:
9781305115545
Author:
James Stewart, Lothar Redlin, Saleem Watson
Publisher:
Cengage Learning

Glencoe Algebra 1, Student Edition, 9780079039897…
Algebra
ISBN:
9780079039897
Author:
Carter
Publisher:
McGraw Hill

Functions and Change: A Modeling Approach to Coll…
Algebra
ISBN:
9781337111348
Author:
Bruce Crauder, Benny Evans, Alan Noell
Publisher:
Cengage Learning
College Algebra
Algebra
ISBN:
9781305115545
Author:
James Stewart, Lothar Redlin, Saleem Watson
Publisher:
Cengage Learning
Glencoe Algebra 1, Student Edition, 9780079039897…
Algebra
ISBN:
9780079039897
Author:
Carter
Publisher:
McGraw Hill
Functions and Change: A Modeling Approach to Coll…
Algebra
ISBN:
9781337111348
Author:
Bruce Crauder, Benny Evans, Alan Noell
Publisher:
Cengage Learning

Big Ideas Math A Bridge To Success Algebra 1: Stu…
Algebra
ISBN:
9781680331141
Author:
HOUGHTON MIFFLIN HARCOURT
Publisher:
Houghton Mifflin Harcourt