ta are available for a river that is to be dammed: 2 104.1 139.7 127.0 94.0 116.8 99.1 15.3 23.2 19.5 16.1 18.1 16.6 regression line for the given data? Plot the linear regression curve along with nat is the prediction of the annual water flow if the precipitation is 122 cm?

Linear Algebra: A Modern Introduction
4th Edition
ISBN:9781285463247
Author:David Poole
Publisher:David Poole
Chapter7: Distance And Approximation
Section7.3: Least Squares Approximation
Problem 31EQ
icon
Related questions
icon
Concept explainers
Question
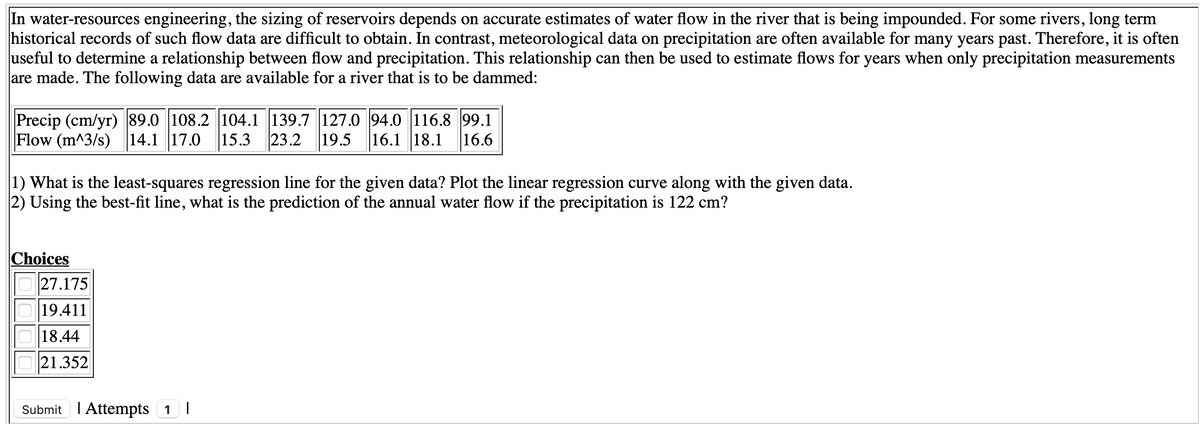
In water-resources engineering, the sizing of reservoirs depends on accurate estimates of water flow in the river that is being impounded. For some rivers, long term
historical records of such flow data are difficult to obtain. In contrast, meteorological data on precipitation are often available for many years past. Therefore, it is often
useful to determine a relationship between flow and precipitation. This relationship can then be used to estimate flows for years when only precipitation measurements
are made. The following data are available for a river that is to be dammed:
Precip (cm/yr) 89.0 108.2 104.1 139.7 127.0 94.0 116.8 99.1
Flow (m^3/s) 14.1 17.0
15.3
23.2
19.5
16.1 18.1
16.6
1) What is the least-squares regression line for the given data? Plot the linear regression curve along with the given data.
2) Using the best-fit line, what is the prediction of the annual water flow if the precipitation is 122 cm?
Choices
27.175
19.411
18.44
21.352
Submit I Attempts 1 |
Transcribed Image Text:In water-resources engineering, the sizing of reservoirs depends on accurate estimates of water flow in the river that is being impounded. For some rivers, long term historical records of such flow data are difficult to obtain. In contrast, meteorological data on precipitation are often available for many years past. Therefore, it is often useful to determine a relationship between flow and precipitation. This relationship can then be used to estimate flows for years when only precipitation measurements are made. The following data are available for a river that is to be dammed: Precip (cm/yr) 89.0 108.2 104.1 139.7 127.0 94.0 116.8 99.1 Flow (m^3/s) 14.1 17.0 15.3 23.2 19.5 16.1 18.1 16.6 1) What is the least-squares regression line for the given data? Plot the linear regression curve along with the given data. 2) Using the best-fit line, what is the prediction of the annual water flow if the precipitation is 122 cm? Choices 27.175 19.411 18.44 21.352 Submit I Attempts 1 |
Expert Solution
steps

Step by step

Solved in 2 steps with 5 images

Blurred answer
Knowledge Booster
Correlation, Regression, and Association
Learn more about
Need a deep-dive on the concept behind this application? Look no further. Learn more about this topic, statistics and related others by exploring similar questions and additional content below.
Recommended textbooks for you
Linear Algebra: A Modern Introduction
Algebra
ISBN:
9781285463247
Author:
David Poole
Publisher:
Cengage Learning
Functions and Change: A Modeling Approach to Coll…
Algebra
ISBN:
9781337111348
Author:
Bruce Crauder, Benny Evans, Alan Noell
Publisher:
Cengage Learning
Glencoe Algebra 1, Student Edition, 9780079039897…
Algebra
ISBN:
9780079039897
Author:
Carter
Publisher:
McGraw Hill