1. See Data 1 in Bb. There are two variables. y: Tensile Strength (Psi) and x: Hardwood Concentration (%). Get scatter plot of y vs x. Explain their statistical relation. Based on the plot write a tentative regression model (you should not fit the model now, just write the model that you think is appropriate using B symbol and x. b. а. Consider Model 1: y=Bo+ß1x + B2x²+ɛ. For Model 1 1. Test overall significance of the model using the F-test. 2. Test the significance of adding x to the model that contains x?. Also, test significance of adding x² to the model that contains x. Write a summary of your findings in this part. 3. Would you retain ß, in Model 1?
1. See Data 1 in Bb. There are two variables. y: Tensile Strength (Psi) and x: Hardwood Concentration (%). Get scatter plot of y vs x. Explain their statistical relation. Based on the plot write a tentative regression model (you should not fit the model now, just write the model that you think is appropriate using B symbol and x. b. а. Consider Model 1: y=Bo+ß1x + B2x²+ɛ. For Model 1 1. Test overall significance of the model using the F-test. 2. Test the significance of adding x to the model that contains x?. Also, test significance of adding x² to the model that contains x. Write a summary of your findings in this part. 3. Would you retain ß, in Model 1?

College Algebra
7th Edition
ISBN:9781305115545
Author:James Stewart, Lothar Redlin, Saleem Watson
Publisher:James Stewart, Lothar Redlin, Saleem Watson
Chapter1: Equations And Graphs
Section: Chapter Questions
Problem 10T: Olympic Pole Vault The graph in Figure 7 indicates that in recent years the winning Olympic men’s...

Related questions
Question
100%
solve 1a and b
Transcribed Image Text:1.
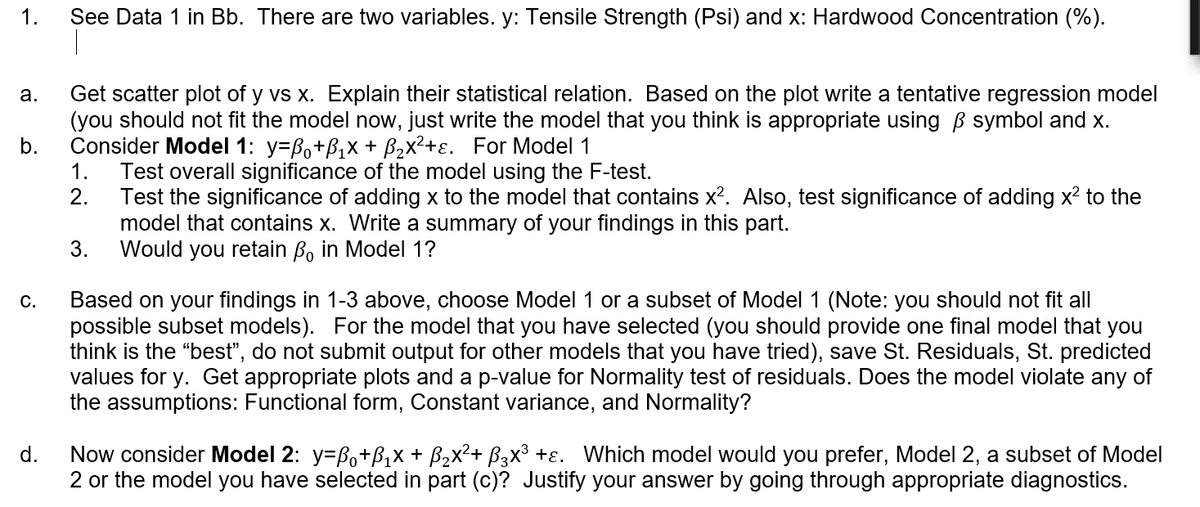
See Data 1 in Bb. There are two variables. y: Tensile Strength (Psi) and x: Hardwood Concentration (%).
Get scatter plot of y vs x. Explain their statistical relation. Based on the plot write a tentative regression model
(you should not fit the model now, just write the model that you think is appropriate using B symbol and x.
b.
а.
Consider Model 1: y=Bo+B,x + B,x²+ɛ. For Model 1
1.
Test overall significance of the model using the F-test.
2.
Test the significance of adding x to the model that contains x². Also, test significance of adding x2 to the
model that contains x. Write a summary of your findings in this part.
3.
Would you retain B, in Model 1?
Based on your findings in 1-3 above, choose Model 1 or a subset of Model 1 (Note: you should not fit all
possible subset models). For the model that you have selected (you should provide one final model that you
think is the "best", do not submit output for other models that you have tried), save St. Residuals, St. predicted
values
С.
y. Get ap
opriat
plots and a p-value for Normality test of residuals. Does the model violate any of
the assumptions: Functional form, Constant variance, and Normality?
Now consider Model 2: y=Bo+B,x + B2x²+ B3x³ +ɛ. Which model would you prefer, Model 2, a subset of Model
2 or the model you have selected in part (c)? Justify your answer by going through appropriate diagnostics.
d.
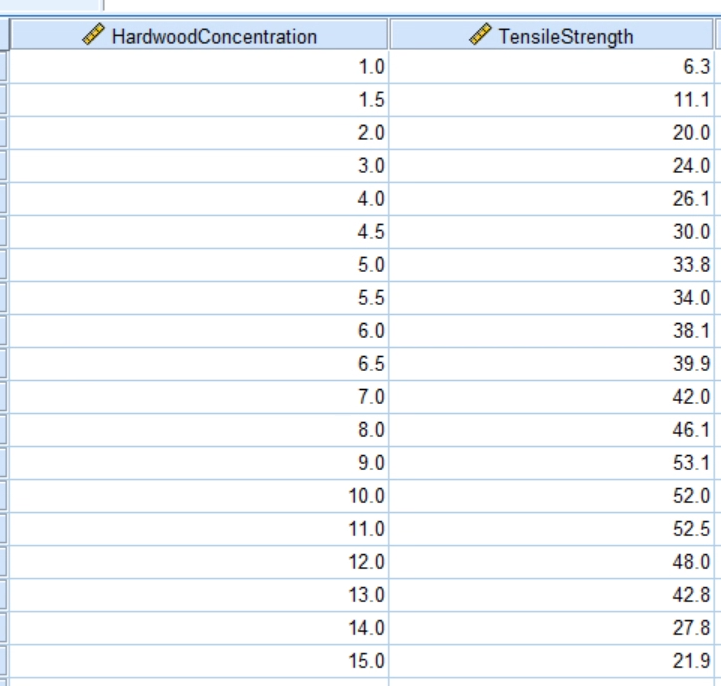
Transcribed Image Text:HardwoodConcentration
* TensileStrength
1.0
6.3
1.5
11.1
2.0
20.0
3.0
24.0
4.0
26.1
4.5
30.0
5.0
33.8
5.5
34.0
6.0
38.1
6.5
39.9
7.0
42.0
8.0
46.1
9.0
53.1
10.0
52.0
11.0
52.5
12.0
48.0
13.0
42.8
14.0
27.8
15.0
21.9
Expert Solution
Step 1: Given:
Let,
x: Hardwood concentration (%).
y: Tensile strength (Psi).
Data:
| x | y |
| 1 | 6.3 |
| 1.5 | 11.1 |
| 2 | 20 |
| 3 | 24 |
| 4 | 26.1 |
| 4.5 | 30 |
| 5 | 33.8 |
| 5.5 | 3 |
| 6 | 38.1 |
| 6.5 | 39.9 |
| 7 | 42 |
| 8 | 46.1 |
| 9 | 53.1 |
| 10 | 52 |
| 11 | 52.5 |
| 12 | 48 |
| 13 | 42.8 |
| 14 | 27.8 |
| 15 | 21.9 |

Trending now
This is a popular solution!

Step by step
Solved in 6 steps with 1 images

Knowledge Booster


Learn more about
Need a deep-dive on the concept behind this application? Look no further. Learn more about this topic, statistics and related others by exploring similar questions and additional content below.Recommended textbooks for you
College Algebra
Algebra
ISBN:
9781305115545
Author:
James Stewart, Lothar Redlin, Saleem Watson
Publisher:
Cengage Learning

Functions and Change: A Modeling Approach to Coll…
Algebra
ISBN:
9781337111348
Author:
Bruce Crauder, Benny Evans, Alan Noell
Publisher:
Cengage Learning
College Algebra
Algebra
ISBN:
9781305115545
Author:
James Stewart, Lothar Redlin, Saleem Watson
Publisher:
Cengage Learning
Functions and Change: A Modeling Approach to Coll…
Algebra
ISBN:
9781337111348
Author:
Bruce Crauder, Benny Evans, Alan Noell
Publisher:
Cengage Learning