Part 3: 3) Identify the critical value. If there are multiple critical values, separate them using commas. If using z, round to 2 decimals; if using t, round to 3 decimals.
Part 3: 3) Identify the critical value. If there are multiple critical values, separate them using commas. If using z, round to 2 decimals; if using t, round to 3 decimals.

MATLAB: An Introduction with Applications
6th Edition
ISBN:9781119256830
Author:Amos Gilat
Publisher:Amos Gilat
Chapter1: Starting With Matlab
Section: Chapter Questions
Problem 1P

Related questions
Question
answer part 3
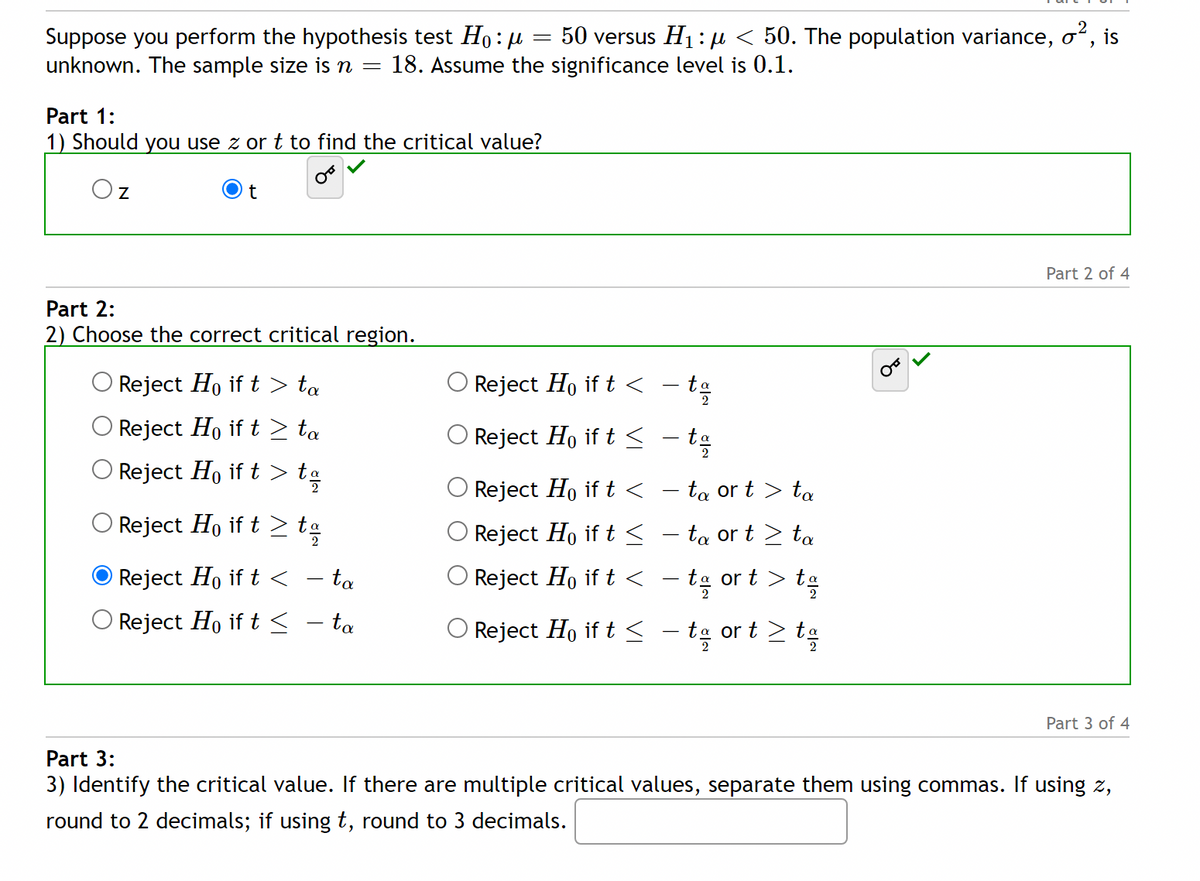
Transcribed Image Text:Suppose you perform the hypothesis test Ho: µ
unknown. The sample size is n =
50 versus H1: µ < 50. The population variance, oʻ,
is
18. Assume the significance level is 0.1.
Part 1:
1) Should you use z or t to find the critical value?
t
Part 2 of 4
Part 2:
2) Choose the correct critical region.
O Reject Ho if t > ta
Reject Ho if t << - to
Reject Ho if t > ta
O Reject Ho if t < - to
O Reject Ho
if t
Reject Ho if t <
- ta or t > t
Reject Ho if t > tg
O Reject Ho if t < - ta or t > ta
Reject Ho if t <
ta
Reject Ho if t < - ta or t > t:
Reject Ho if t < – ta
O Reject Ho if t< - ta or t > ta
Part 3 of 4
Part 3:
3) Identify the critical value. If there are multiple critical values, separate them using commas. If using z,
round to 2 decimals; if using t, round to 3 decimals.
Expert Solution
This question has been solved!
Explore an expertly crafted, step-by-step solution for a thorough understanding of key concepts.

This is a popular solution!

Trending now
This is a popular solution!

Step by step
Solved in 2 steps with 2 images

Recommended textbooks for you
MATLAB: An Introduction with Applications
Statistics
ISBN:
9781119256830
Author:
Amos Gilat
Publisher:
John Wiley & Sons Inc

Probability and Statistics for Engineering and th…
Statistics
ISBN:
9781305251809
Author:
Jay L. Devore
Publisher:
Cengage Learning

Statistics for The Behavioral Sciences (MindTap C…
Statistics
ISBN:
9781305504912
Author:
Frederick J Gravetter, Larry B. Wallnau
Publisher:
Cengage Learning
MATLAB: An Introduction with Applications
Statistics
ISBN:
9781119256830
Author:
Amos Gilat
Publisher:
John Wiley & Sons Inc
Probability and Statistics for Engineering and th…
Statistics
ISBN:
9781305251809
Author:
Jay L. Devore
Publisher:
Cengage Learning
Statistics for The Behavioral Sciences (MindTap C…
Statistics
ISBN:
9781305504912
Author:
Frederick J Gravetter, Larry B. Wallnau
Publisher:
Cengage Learning

Elementary Statistics: Picturing the World (7th E…
Statistics
ISBN:
9780134683416
Author:
Ron Larson, Betsy Farber
Publisher:
PEARSON

The Basic Practice of Statistics
Statistics
ISBN:
9781319042578
Author:
David S. Moore, William I. Notz, Michael A. Fligner
Publisher:
W. H. Freeman

Introduction to the Practice of Statistics
Statistics
ISBN:
9781319013387
Author:
David S. Moore, George P. McCabe, Bruce A. Craig
Publisher:
W. H. Freeman