1. Suppose that we are testing Ho: p = Ho versus H₁ μμo. Calculate the p-value for the following observed values of the test statistic: (a) Zo= 2.25 (c) Zo= -2.10 (e) Zo= -0.10 (b) Zo = 1.55 (d) Zo 1.95 =
1. Suppose that we are testing Ho: p = Ho versus H₁ μμo. Calculate the p-value for the following observed values of the test statistic: (a) Zo= 2.25 (c) Zo= -2.10 (e) Zo= -0.10 (b) Zo = 1.55 (d) Zo 1.95 =

MATLAB: An Introduction with Applications
6th Edition
ISBN:9781119256830
Author:Amos Gilat
Publisher:Amos Gilat
Chapter1: Starting With Matlab
Section: Chapter Questions
Problem 1P

Related questions
Question
Show all necessary solutions.
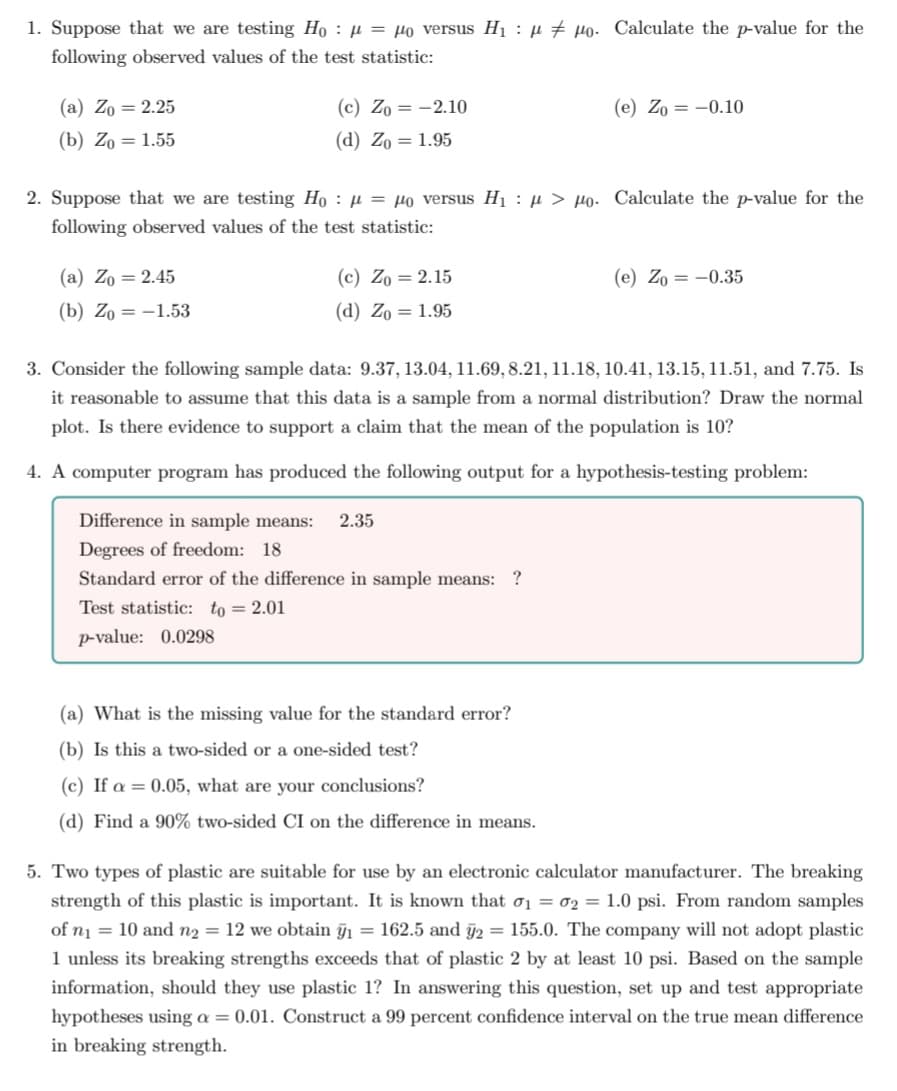
Transcribed Image Text:1. Suppose that we are testing Ho: μ = μo versus H₁ μpo. Calculate the p-value for the
following observed values of the test statistic:
(a) Zo= 2.25
(c) Zo-2.10
(e) Zo= -0.10
(b) Zo= 1.55
(d) Zo = 1.95
2. Suppose that we are testing Ho μ = μo versus H₁ μ> po. Calculate the p-value for the
following observed values of the test statistic:
(a) Zo = 2.45
(c) Zo = 2.15
(e) Zo= -0.35
(b) Zo= -1.53
(d) Zo = 1.95
3. Consider the following sample data: 9.37, 13.04, 11.69, 8.21, 11.18, 10.41, 13.15, 11.51, and 7.75. Is
it reasonable to assume that this data is a sample from a normal distribution? Draw the normal
plot. Is there evidence to support a claim that the mean of the population is 10?
4. A computer program has produced the following output for a hypothesis-testing problem:
Difference in sample means: 2.35
Degrees of freedom: 18
Standard error of the difference in sample means: ?
Test statistic: to 2.01
p-value: 0.0298
(a) What is the missing value for the standard error?
(b) Is this a two-sided or a one-sided test?
(c) If a = 0.05, what are your conclusions?
(d) Find a 90% two-sided CI on the difference in means.
5. Two types of plastic are suitable for use by an electronic calculator manufacturer. The breaking
strength of this plastic is important. It is known that 0₁ = 02 = 1.0 psi. From random samples
of n₁ = 10 and n₂ = 12 we obtain ỹ₁ = 162.5 and ÿ2 = 155.0. The company will not adopt plastic
1 unless its breaking strengths exceeds that of plastic 2 by at least 10 psi. Based on the sample
information, should they use plastic 1? In answering this question, set up and test appropriate
hypotheses using a = 0.01. Construct a 99 percent confidence interval on the true mean difference
in breaking strength.
Expert Solution
This question has been solved!
Explore an expertly crafted, step-by-step solution for a thorough understanding of key concepts.

This is a popular solution!

Trending now
This is a popular solution!

Step by step
Solved in 3 steps with 3 images

Recommended textbooks for you
MATLAB: An Introduction with Applications
Statistics
ISBN:
9781119256830
Author:
Amos Gilat
Publisher:
John Wiley & Sons Inc

Probability and Statistics for Engineering and th…
Statistics
ISBN:
9781305251809
Author:
Jay L. Devore
Publisher:
Cengage Learning

Statistics for The Behavioral Sciences (MindTap C…
Statistics
ISBN:
9781305504912
Author:
Frederick J Gravetter, Larry B. Wallnau
Publisher:
Cengage Learning
MATLAB: An Introduction with Applications
Statistics
ISBN:
9781119256830
Author:
Amos Gilat
Publisher:
John Wiley & Sons Inc
Probability and Statistics for Engineering and th…
Statistics
ISBN:
9781305251809
Author:
Jay L. Devore
Publisher:
Cengage Learning
Statistics for The Behavioral Sciences (MindTap C…
Statistics
ISBN:
9781305504912
Author:
Frederick J Gravetter, Larry B. Wallnau
Publisher:
Cengage Learning

Elementary Statistics: Picturing the World (7th E…
Statistics
ISBN:
9780134683416
Author:
Ron Larson, Betsy Farber
Publisher:
PEARSON

The Basic Practice of Statistics
Statistics
ISBN:
9781319042578
Author:
David S. Moore, William I. Notz, Michael A. Fligner
Publisher:
W. H. Freeman

Introduction to the Practice of Statistics
Statistics
ISBN:
9781319013387
Author:
David S. Moore, George P. McCabe, Bruce A. Craig
Publisher:
W. H. Freeman