(9. The following table gives the distribution of items of production and also h rufativety defective items among them, according to size groups. Find the correlation coefficient between size and defect in quality and its probable error. 18-19 Size-group 15-16 16-17 17-18 19-20 20-21 : No. of items 200 270 340 360 400 300 180 No. of defective items : 180 ban 150 162 170 114
(9. The following table gives the distribution of items of production and also h rufativety defective items among them, according to size groups. Find the correlation coefficient between size and defect in quality and its probable error. 18-19 Size-group 15-16 16-17 17-18 19-20 20-21 : No. of items 200 270 340 360 400 300 180 No. of defective items : 180 ban 150 162 170 114

Glencoe Algebra 1, Student Edition, 9780079039897, 0079039898, 2018
18th Edition
ISBN:9780079039897
Author:Carter
Publisher:Carter
Chapter10: Statistics
Section10.6: Summarizing Categorical Data
Problem 23PPS

Related questions
Question
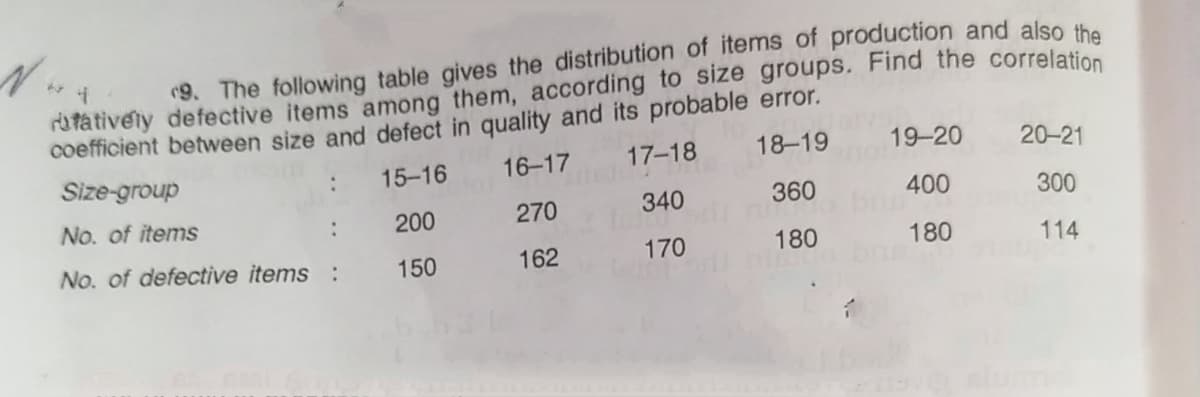
Transcribed Image Text:9. The following table gives the distribution of items of production and also the
rufativety defective items among them, according to size groups. Find the correlation
coefficient between size and defect in quality and its probable error.
18-19
Size-group
17-18
19-20
20-21
15-16
16-17
No. of items
200
270
340
360
400
300
:
No. of defective items
150
162
170
180
180
114
:
Expert Solution
This question has been solved!
Explore an expertly crafted, step-by-step solution for a thorough understanding of key concepts.

Step by step
Solved in 3 steps with 2 images

Recommended textbooks for you
Glencoe Algebra 1, Student Edition, 9780079039897…
Algebra
ISBN:
9780079039897
Author:
Carter
Publisher:
McGraw Hill
Glencoe Algebra 1, Student Edition, 9780079039897…
Algebra
ISBN:
9780079039897
Author:
Carter
Publisher:
McGraw Hill