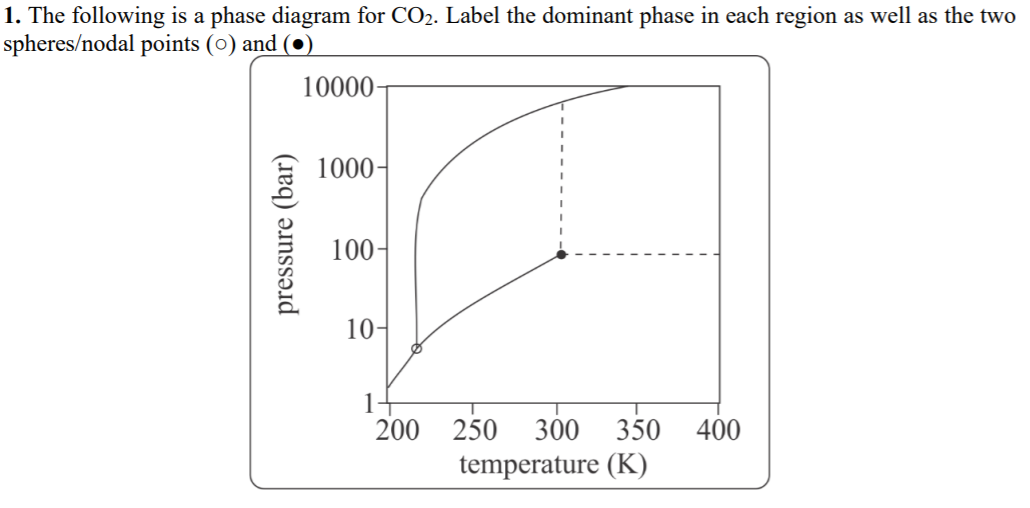
1. The following is a phase diagram for CO2. Label the dominant phase in each region as well as the two spheres/nodal points (0) and (●) 10000 1000- 100- 10- 1+ 200 250 300 350 400 temperature (K) pressure (bar)


Q: a)Draw the Naphthalene Phase Diagram[MM= 128.2[g/mol]] Numerically indicate your triple point, and…
A: since you have posted multiple questions in a single session, we are entitiled to answer only first…
Q: Describe the behavior on distillation of a 98% ethanol solution through an efficient column. Refer…
A: The process in which liquids having different vapor pressure are separated is called as…
Q: 4- Consider the phase diagram given below. What phases are present at points A through H? Identify…
A:
Q: How many phases are present in the following systems? Also define each of the erminologies…
A: Phases They are the homogeneous and distinct of a system without the visible boundary. Phase diagram…
Q: b: T, T3 0.6 0.4 XB 0.2 0.8 1 Temperature, T ......
A: In this phase diagram there are more than two congruent compounds present: A+B→AB2 +A2B At different…
Q: The fragment of H2O phase diagram is shown. A) What transition (e.g. liquid--> solid,…
A: B) from the above graph we can see that at P = 1 atm and T = 100 C, the point lies at position as…
Q: O A Z M + > } 1 1:28 PM 7/23/2022 Ba-
A: We know at high pressure and low temperature the atoms of a substance tend to remain close to each…
Q: 1.900 x 10⁶ J of heat is added to a cylinder of aluminum (radius 5.000 cm, length 10.00 cm) at room…
A: Explanation to the correct answer is given below
Q: Part A - Interpreting a Phase Diagram Based on the phase diagram for methane below, what happens to…
A: phase diagram tells us whether a given compound will be solid ,liquid or gas at different…
Q: 2. Answer the below questions about the phase diagram for nitrogen (N₂). (image from astrocamp.org)…
A: Given:- Phase diagram of Nitrogen showing its boiling point melting point and phase at different…
Q: What phase change would occur iat a constant pressure of 0.25 atm the temperature was increased from…
A: The answer is as follows:
Q: A phase change graph is shown below. Assume that pressure is constant. Choose the image that best…
A:
Q: State the five (5) important parameters of phase diagrams.
A: Generally in a phase diagram temperature on x-axis versus pressure on y axis is plotted. It is a…
Q: (b) Why does the liquid-gas coexistence curve in a P-T phase diagram end at the critical point? Draw…
A: The three different phases that are common for a substance are solid, liquid, and gas. In the solid…
Q: 9.The diagram below is an example of Liquid-Solid-Temperature Composition Phase Diagram of Reacting…
A: The given phase diagram is:
Q: The phase diagram of a hypothetical substance is shown below. 1.0 0.5 0. 100 200 300 Temperature (K)…
A:
Q: Substance X is known to exist at 1 atm in the solid, liquid, or vapor phase, depending on the…
A: The sample is below the melting point initially and thus, it is in solid state. Calculate needed to…
Q: the phase diagram given phases are present at points A through H? Identify the triple point, normal…
A: The portion of the graph marked as A represents solid phase, the portion of the graph marked as B…
Q: The phase diagram for an organic compound is shown. 1.00 - Pressure (atm) 0.50- 0.10 0 50…
A: The three states of matter in the given phase diagram are as follows:
Q: The heat of vaporization of water at 373 K is 40.7 KJ/mol. When 4.50 g of steam condenses at 373 K,…
A: Number of moles of water (steam) can be calculated as follows: No.of moles of water = massmolar…
Q: The following information is given for water at latm: boiling point = 100 °C AHvap(100 °C)-40.7…
A: The mass of solid water sample is = 44.1 g The heat of fusion of water at its normal melting point…
Q: What is the melting point of the substance modeled by this heating curve? F. 150 135 120 D 105 90 75…
A:
Q: Phase diagram for mysterious compound X 100 90 80 liquid 70 solid 60 50 40 gas Pressure (atm)
A: Phase diagram is a graphical representation of physical states of substance under different…
Q: The following information is given for bismuth at 1atm: boiling point = 1627 °C Hvap(1627 °C) =…
A: Given, Mass of Bi = 35.8 g boiling point = 1627 °C Hvap(1627 °C) = 172 kJ/mol melting point =…
Q: Constructing a Phase Diagram: In this activity you will draft a phase diagram based on the…
A:
Q: C Critical polnt A B. Triple point Temperature Choose the correct set of phase transitions observed…
A:
Q: Consider the following phase diagram: Pressure (atm) 1.0 0.5 0 O 50 K O 100 K 200 K D O 300 K O 360…
A: 0° C = 273 K.... 1 atm = 760 torr... The boiling point is the temperature at which a liquid changes…
Q: How many phases are present at each of the points a–d indicated in Fig. 4.1a?
A: The phase diagram is a graphical representation of the physical states of a substance under…
Q: The phase diagram of a hypothetical substance is shown below. 1.0 0.5F 100 200 300 400 Temperature…
A: From the graph we can sketch the co-ordinate point given to us, i.e; T=150 K and P=0.8 atm
Q: 140- Heating Curve for 1.00 mole of Substance X 120- 100- 80- 60- 40 0. 10 20 30 40 50A 60 70 80 90…
A: The graph for the process is :
Q: 4- Consider the phase diagram given below. What phases are present at points A through H? Identify…
A: To understand the phase diagram, certain important terms are needed to be explained first. In a…
Q: 6. Visualize a substance with the following points on the phase diagram: a triple point at 0.5 atm…
A: Since you have posted a question with multiple sub-parts, we will solve first three subparts for…
Q: he phase diagram for a pure substance is shown above. Use this diagram and your knowledge about…
A: This is the phase diagram of water. A) Point V represents the Triple point. At this triple point,…
Q: Sketch a well-labelled typical phase diagram for a pure substance, and label all regions…
A: Phase diagram of pure substance
Q: 11.The diagram below is an example of Liquid-Solid-Temperature Composition Phase Diagram of Reacting…
A: The given phase diagram is:
Q: The phase diagram of a substance is shown below. 260 10-2 100 200 300 400 Temperature (K) What is…
A:
Q: The following information is given for antimony at 1 atm: AHvap(1440 °C) = 195 kJ/mol AHfa(631 °C) =…
A:
Q: Q. 2. (a) Identify the phase diagram, and explain the curve OB, OA and OC. Also, in case of reduced…
A: Given: 2 (a) identify the phase diagram and explain curve OB, OA and OC. 2 (b) 3.5 x 10⁻⁴ M solution…
Q: ne following three questions (18 - 21), refer to the phase diagram below. 1000-- 100-- VI 10-- IV…
A: The explanation is given below-
Q: Q6) A substance has a latent heat of vaporization of 10 J/kg and a boiling point of 500 K at…
A:
Q: 11.61 The phase diagram for neon is blupl Liquid Supercritical 103 Stio nobtoin3o 102 fluid bpszs…
A: a. The normal melting point is the temperature where solid becomes liquid at 1atm pressure.…
Q: Pressure (atm) 1. Label the various regions of the graph. 1000 A Solid-gas phase change 100 B)…
A: In the given, Pressure Temperature diagram, the solid phase is shown by Green color, liquid phase…
Q: 2 According to the below given phase diagram, what is the approximate value of the normal boiling…
A: Phase diagrams gives the relation between temperature and pressure of the compound at different…
Q: 1. How many phases exists below the curve? a. 0 b. 1 c. 2 d. 3. 2. How many phases exists above the…
A: Given: The phase diagram for the system nitrobenzene/hexane at 1 atm. Since you have posted a…
Q: Given the phase diagram, what is the normal melting/freezing point of the substance? 2.00 1.75 1.50…
A: When a liquid converts into solid it is known as Freezing. And When a solid converts into a liquid…
Q: Phase Diagram 4 1 3 Temperature Pressure
A: The graphical representation of the physical state of the substance under different pressure and…
Q: The following information is given for silver at 1atm: boiling point = 2212 °C Hvap(2212 °C) = 254…
A: The normal melting point of the silver is 961 °C. The molar heat of fusion of silver is 12.0 kJ. The…
Q: 3-The phase diagram below is for a pure substance. Explain what is wrong with phase diagram a
A:
Q: The phase diagram of a substance is given below. The region marked "x" represents: super critical…
A: Phase diagram gives the information regarding phase transition of any substance.
Q: The phase diagram of a hypothetical substance is shown below. 1.0 0.5 100 200 300 400 Temperature…
A: The phase diagram given is,
Q: Water's unary phase diagram has a triple point at 0.01 °C and 0.006 atm, and a solid-liquid boundary…
A: Phase diagram of water
Q: 1. Phase Changes Elemental sulfur exhibits five (5) common phases. There are two solid phases of…
A:
Q: Identify the areas/points in the following phase diagram. 1,000+ 800 P (torr) 600 400 200 -10 10 20…
A: A phase diagram is a graph which shows under what conditions of temperature and pressure distinct…
Q: The following information is given for cobalt at 1atm: boiling point = 3097 °C Hvap(3097 °C) = 389…
A:
Q: ng phase diagram of Substa
A:
Q: 3. What is the normal melting point of the substance? 4. What phase(2) will exist at 1 atm and 70…
A:
Q: Part B The phase diagram for an organic compound is shown. 1.00 Y Pressure (atm) 0.50 0.10 -200 -100…
A: Boiling point is defined as the temperature at which a solid starts melting and becomes liquid. it…


Trending now
This is a popular solution!

Step by step
Solved in 2 steps with 2 images

- give 5 examples of a 1 phase diagram and show its phase ruleAnswers must be typed out, using units, in the simplest logical manner EXPLANATION CANNOT BE HAND-DRAWN Phase Diagram for CO2The phase diagram for CO2 is shown in Figure 17-38 . (a) What is the phase of CO2 at T=20°C and P=500 kPa? (b) What is the phase of CO2 at T=−80°C and P=120 kPa? (c) For reasons of economy and convenience, bulk CO2 is often transported in liquid form in pressurized tanks. Using the phase diagram, determine the minimum pressure required to keep CO2 in the liquid phase at 20 °C.The solid–liquid equilibrium line in the phase diagram of water has a negative slope, equal to −0.0076 °C bar−1. Calculate the freezing point of water beneath a glacier that is 3 km high and has a density of 917 kg/m3.
- Sketch a well-labelled typical phase diagram for a pure substance, and label all regions appropriately.Based on the ternary phase diagram, a binary mixture of furfural and water will always split into two liquid phases: 1) 95 % furfural, 5 % H2O and 2) 92 % H2O, 8 % furfural. Neither true nor false True False The actual composition depends on other experimental parameters.The following information is given for water at 1atm: boiling point = 100 °C Hvap(100 °C) = 40.7 kJ/mol melting point = 0 °C Hfus(0 °C) = 6.01 kJ/mol specific heat solid= 2.10 J/g°C specific heat liquid = 4.18 J/g°C What is H in kJ for the process of freezing a 41.7 g sample of liquid water at its normal melting point of 0 °C. _____KJ
- Which of the following phase diagrams corresponds to a system wherein the upper critical temperature is less than the boiling point at all compositions? A C E D BWhat named equation(s) define the lines in single-component phase diagrams?The following information is given for bismuth at 1atm: boiling point = 1627 °C Hvap(1627 °C) = 172 kJ/mol melting point = 271 °C Hfus(271 °C) = 11.0 kJ/mol specific heat solid= 0.126 J/g°C specific heat liquid = 0.151 J/g°C What is H in kJ for the process of freezing a 35.8 g sample of liquid bismuth at its normal melting point of 271 °C.________ kJ
- The following information is given for silver at 1atm: boiling point = 2212 °C Hvap(2212 °C) = 254 kJ/mol melting point = 961 °C Hfus(961 °C) = 12.0 kJ/mol specific heat solid= 0.238 J/g°C specific heat liquid = 0.285 J/g°C What is H in kJ for the process of freezing a 45.2 g sample of liquid silver at its normal melting point of 961 °C.1. How many triple points are there? 2. What is the most stable form of sulphur under normal conditions? 3. Describe what happens when sulphur at 1 atm is heated from 80 decrees Celsius to 200 decrees Celsius. 4. Determine the volume change for the transformation from rhombic to Monoclinic sulphur. 5. Estimate the pressure at which rhombic and monoclinic sulphur coexist in equilibrium at a temperature of 373 K.The figure below is the solid-liquid phase diagram for the substances A and B. a) Label the number of phases and the substances in equilibrium in each region. b) Identify the region(s) where three phases coexist in equilibrium. c) Describe what will be observed when liquids of compositions a and b are cooled to a temperature just under T2. Please answer all parts