1. The following table gives data for the frequency of genotypes in a population of sunflower plants from a coastal sage scrub community over the course of 50 generations. Gene products of the A allele produce stems without hairs, while gene products of the a allele produce stems with short hairs but flowers with many infertile stamens, and the a' allele produces stems with dense hairs and flowers with all fertile stamens. Note that it may cost the plants greatly in extra carbon to produce these hairs. At the onset of this survey, an invasive insect species that feeds upon the buds of sunflowers had been accidentally introduced into the habitat of this plant population. This insect makes its living by ascending the stems of herbaceous plants rather than landing upon the flower stalks or stems. Thus, dense hairs would impede the ability of this insect to reach the buds. Interpret the results of the data and explain how natural selection might be driving the genotype frequencies in this sunflower population. What might you hypothesize about the adaptive trade-offs of these traits? Provide a graph of the data (hint: genotype frequency is the dependent variable and the individual genotypes are factors). Genotype AA Aa aa Aa' aa' a'a' Generation 1 0.302 0.167 0.091 0.134 0.124 0.182 Generation 10 0.225 0.126 0.053 0.184 0.160 0.252 Generation 25 0.184 0.089 0.044 0.196 0.180 0.307 Generation 50 0.140 0.071 0.026 0.216 0.204 0.367
1. The following table gives data for the frequency of genotypes in a population of sunflower plants from a coastal sage scrub community over the course of 50 generations. Gene products of the A allele produce stems without hairs, while gene products of the a allele produce stems with short hairs but flowers with many infertile stamens, and the a' allele produces stems with dense hairs and flowers with all fertile stamens. Note that it may cost the plants greatly in extra carbon to produce these hairs. At the onset of this survey, an invasive insect species that feeds upon the buds of sunflowers had been accidentally introduced into the habitat of this plant population. This insect makes its living by ascending the stems of herbaceous plants rather than landing upon the flower stalks or stems. Thus, dense hairs would impede the ability of this insect to reach the buds. Interpret the results of the data and explain how natural selection might be driving the genotype frequencies in this sunflower population. What might you hypothesize about the adaptive trade-offs of these traits? Provide a graph of the data (hint: genotype frequency is the dependent variable and the individual genotypes are factors). Genotype AA Aa aa Aa' aa' a'a' Generation 1 0.302 0.167 0.091 0.134 0.124 0.182 Generation 10 0.225 0.126 0.053 0.184 0.160 0.252 Generation 25 0.184 0.089 0.044 0.196 0.180 0.307 Generation 50 0.140 0.071 0.026 0.216 0.204 0.367

Biology: The Dynamic Science (MindTap Course List)
4th Edition
ISBN:9781305389892
Author:Peter J. Russell, Paul E. Hertz, Beverly McMillan
Publisher:Peter J. Russell, Paul E. Hertz, Beverly McMillan
Chapter21: Microevolution: Genetic Changes Within Populations
Section: Chapter Questions
Problem 8TYK: If the genotype frequencies in a population are 0.60 AA, 0.20 Aa, and 0.20 aa, and if the...

Related questions

Topic Video
Question
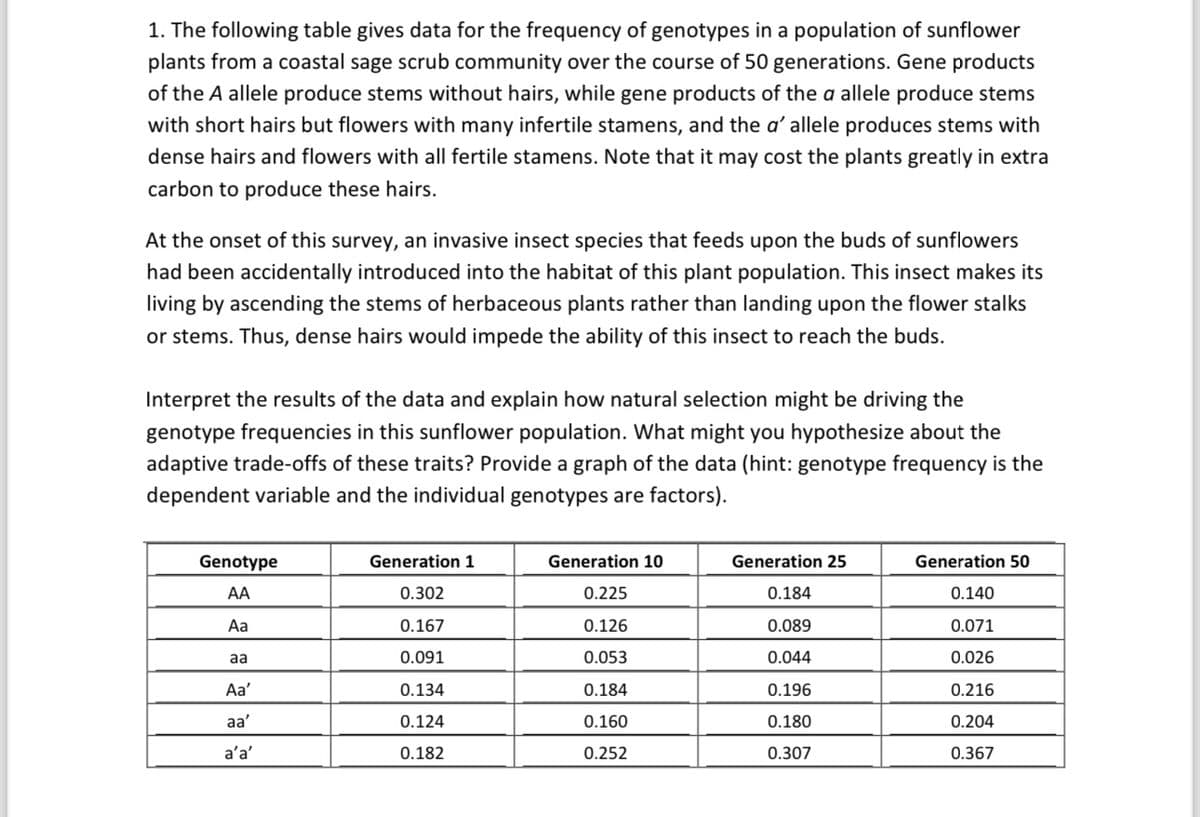
Transcribed Image Text:1. The following table gives data for the frequency of genotypes in a population of sunflower
plants from a coastal sage scrub community over the course of 50 generations. Gene products
of the A allele produce stems without hairs, while gene products of the a allele produce stems
with short hairs but flowers with many infertile stamens, and the a' allele produces stems with
dense hairs and flowers with all fertile stamens. Note that it may cost the plants greatly in extra
carbon to produce these hairs.
At the onset of this survey, an invasive insect species that feeds upon the buds of sunflowers
had been accidentally introduced into the habitat of this plant population. This insect makes its
living by ascending the stems of herbaceous plants rather than landing upon the flower stalks
or stems. Thus, dense hairs would impede the ability of this insect to reach the buds.
Interpret the results of the data and explain how natural selection might be driving the
genotype frequencies in this sunflower population. What might you hypothesize about the
adaptive trade-offs of these traits? Provide a graph of the data (hint: genotype frequency is the
dependent variable and the individual genotypes are factors).
Genotype
AA
Aa
aa
Aa'
aa'
a'a'
Generation 1
0.302
0.167
0.091
0.134
0.124
0.182
Generation 10
0.225
0.126
0.053
0.184
0.160
0.252
Generation 25
0.184
0.089
0.044
0.196
0.180
0.307
Generation 50
0.140
0.071
0.026
0.216
0.204
0.367
Expert Solution
This question has been solved!
Explore an expertly crafted, step-by-step solution for a thorough understanding of key concepts.

This is a popular solution!

Trending now
This is a popular solution!

Step by step
Solved in 4 steps

Knowledge Booster


Learn more about
Need a deep-dive on the concept behind this application? Look no further. Learn more about this topic, biology and related others by exploring similar questions and additional content below.Recommended textbooks for you
Biology: The Dynamic Science (MindTap Course List)
Biology
ISBN:
9781305389892
Author:
Peter J. Russell, Paul E. Hertz, Beverly McMillan
Publisher:
Cengage Learning

Biology: The Unity and Diversity of Life (MindTap…
Biology
ISBN:
9781305073951
Author:
Cecie Starr, Ralph Taggart, Christine Evers, Lisa Starr
Publisher:
Cengage Learning
Biology: The Dynamic Science (MindTap Course List)
Biology
ISBN:
9781305389892
Author:
Peter J. Russell, Paul E. Hertz, Beverly McMillan
Publisher:
Cengage Learning
Biology: The Unity and Diversity of Life (MindTap…
Biology
ISBN:
9781305073951
Author:
Cecie Starr, Ralph Taggart, Christine Evers, Lisa Starr
Publisher:
Cengage Learning