1. Time Series. Suppose you have quarterly data on new housing starts yt, interest rates rt, and real per-capital income gt. (a) Specify a model for housing starts that accounts for possible trends and seasonality in the variables
1. Time Series. Suppose you have quarterly data on new housing starts yt, interest rates rt, and real per-capital income gt. (a) Specify a model for housing starts that accounts for possible trends and seasonality in the variables

MATLAB: An Introduction with Applications
6th Edition
ISBN:9781119256830
Author:Amos Gilat
Publisher:Amos Gilat
Chapter1: Starting With Matlab
Section: Chapter Questions
Problem 1P

Related questions
Question
!
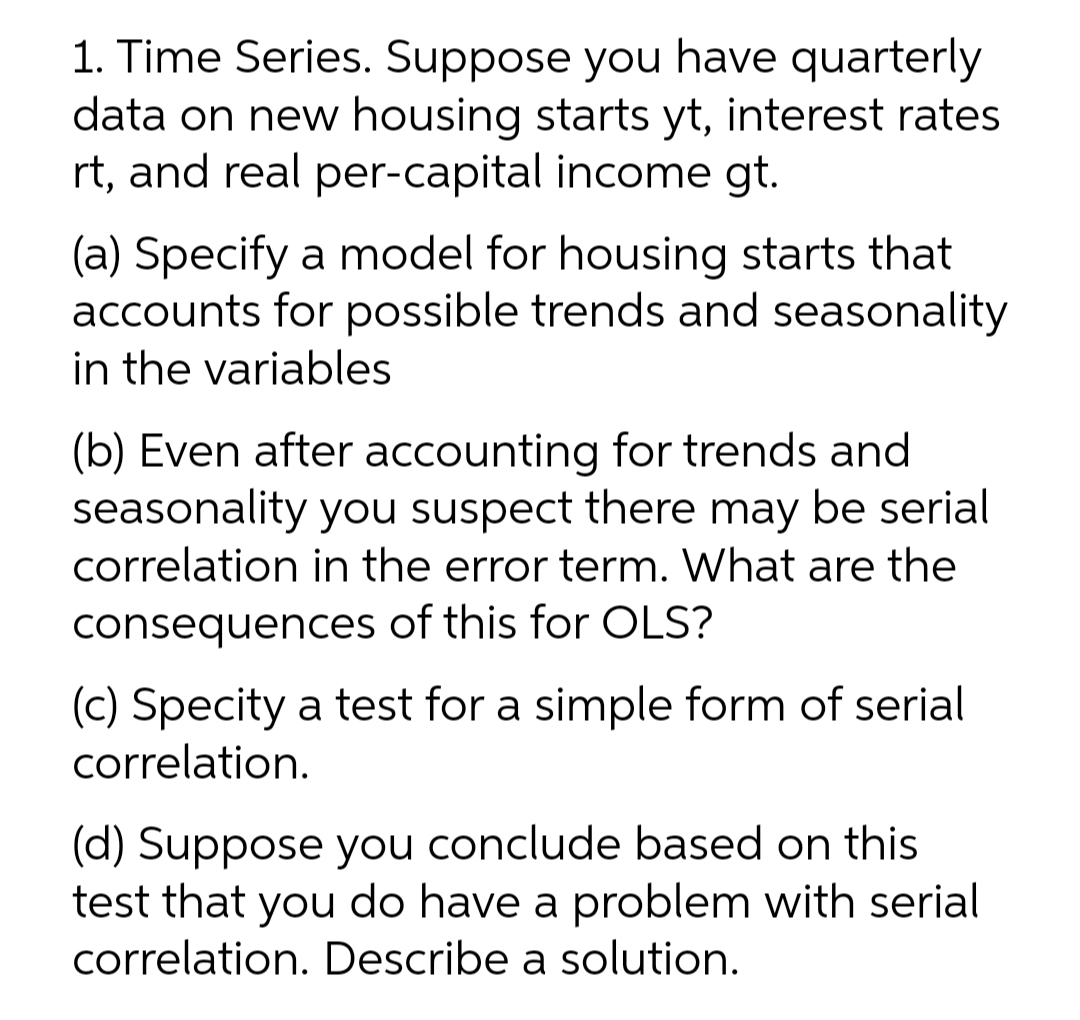
Transcribed Image Text:1. Time Series. Suppose you have quarterly
data on new housing starts yt, interest rates
rt, and real per-capital income gt.
(a) Specify a model for housing starts that
accounts for possible trends and seasonality
in the variables
(b) Even after accounting for trends and
seasonality you suspect there may be serial
correlation in the error term. What are the
consequences of this for OLS?
(c) Specity a test for a simple form of serial
correlation.
(d) Suppose you conclude based on this
test that you do have a problem with serial
correlation. Describe a solution.
Expert Solution
This question has been solved!
Explore an expertly crafted, step-by-step solution for a thorough understanding of key concepts.

Step by step
Solved in 2 steps

Recommended textbooks for you
MATLAB: An Introduction with Applications
Statistics
ISBN:
9781119256830
Author:
Amos Gilat
Publisher:
John Wiley & Sons Inc

Probability and Statistics for Engineering and th…
Statistics
ISBN:
9781305251809
Author:
Jay L. Devore
Publisher:
Cengage Learning

Statistics for The Behavioral Sciences (MindTap C…
Statistics
ISBN:
9781305504912
Author:
Frederick J Gravetter, Larry B. Wallnau
Publisher:
Cengage Learning
MATLAB: An Introduction with Applications
Statistics
ISBN:
9781119256830
Author:
Amos Gilat
Publisher:
John Wiley & Sons Inc
Probability and Statistics for Engineering and th…
Statistics
ISBN:
9781305251809
Author:
Jay L. Devore
Publisher:
Cengage Learning
Statistics for The Behavioral Sciences (MindTap C…
Statistics
ISBN:
9781305504912
Author:
Frederick J Gravetter, Larry B. Wallnau
Publisher:
Cengage Learning

Elementary Statistics: Picturing the World (7th E…
Statistics
ISBN:
9780134683416
Author:
Ron Larson, Betsy Farber
Publisher:
PEARSON

The Basic Practice of Statistics
Statistics
ISBN:
9781319042578
Author:
David S. Moore, William I. Notz, Michael A. Fligner
Publisher:
W. H. Freeman

Introduction to the Practice of Statistics
Statistics
ISBN:
9781319013387
Author:
David S. Moore, George P. McCabe, Bruce A. Craig
Publisher:
W. H. Freeman