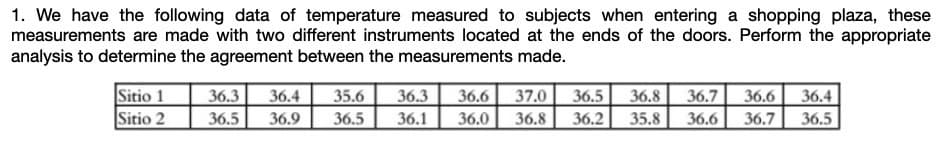
1. We have the following data of temperature measured to subjects when entering a shopping plaza, these measurements are made with two different instruments located at the ends of the doors. Perform the appropriate analysis to determine the agreement between the measurements made. Sitio 1 Sitio 2 36.3 36.4 36.3 36.6 36.0 35.6 37.0 36.5 36.8 36.7 36.6 36.4 36.5 36.5 36.9 36.5 36.1 36.8 36.2 35.8 36.6 36.7


Q: For the following information on a data set: Measurement Class .00-.75 .75-1.50 1.50-2.25 2.25-3.00…
A: The relative frequencies of a data set are given.
Q: Male 0.48 0.36 0.20 0.55 0.45 0.46 0.47 0.23 Female 0.35 0.37 0.27 0.29 Is there any evidence that…
A:
Q: number of passengers using temperature. a) What best describes the relationship between…
A:
Q: 7. The measurement value of FEEM absorbance in microalgae-contaminated water is as follows. FEEM…
A: For the given sample values, Mean=9.7803, obtained from the excel =AVERAGE(O1:O18) Standard…
Q: Given are the scores of 10 employees from their 20-point assessment 16 18 10 8 12 15 19 17 16 7…
A:
Q: Human blood is grouped into four types: A, B, AB and O. The percent's of people in Suva with each…
A: Hello! As you have posted 4 different questions, we are answering the first question. In case you…
Q: 2. For the following information on a data set: Measurement Class .00-.75 75-1.50 1.50-2.25…
A: The given frequency distribution table is,
Q: Listed below are body temperatures from five different subjects measured at 8 AM and again at 12 AM.…
A: Here, x y d=x-y d-d (d-d)2 98.1 98.5 -0.4 -0.26 0.0676 98.8 99.1 -0.3 -0.16 0.0256 97.1…
Q: Given are the scores of 10 employees from their 20-point assessment 16 18 10 8 12 15 19 17 16 7…
A: Given are the scores of 10 employees from their 20-point assessment Scores are :…
Q: When asked how many times a week they go on SNAPCHAT, 10 students replied as follows: 12 10…
A: Mean is the most frequently used measure of central tendency and generally considered the best…
Q: To test the water boiling point temperature,( 9) measurements were taken out as below: (99.3, 99.4,…
A: Given information: The data represents the 9 measurements of water boiling points.
Q: he following data are measurements of temperature (x = °F) and chirping frequency (y = chirps per…
A: Consider that x is the independent variable and y is the dependent variable. The number of…
Q: (c) Determine the measurement scales for the following statements. (i) The lecturer of Quantitative…
A: Given, The different statements then we have to give type of measurement.
Q: Given are the scores of 10 employees from their 20-point assessment 16 18 10 8 12 15 19 17 16 7…
A: Given : n = 10 Data: 16,18,10,8,12,15,19,17,16,7
Q: From the data given belaw construct Dorbish & Bowley's Price Index Number. Commodity poqo pı/po…
A: Formula for calculating Dorbish and bowley's price index number is given by,
Q: The following are quality control data for a manufacturing process at Kensport Chemical Company. The…
A: The given data set: Sample X R 1 95.72 1.0 2 95.24 0.9 3 95.18 0.9…
Q: Note: round your results to three (0.000) decimals 1- The following data represent the heights (cm)…
A: The mean of any data set is computed using the formula x¯=∑xn and the sample standard deviation is…
Q: Consider the following temperature readings (measured in Celsius scale) of few days in Dhaka city…
A:
Q: The following are quality control data for a manufacturing process at Kensport Chemical Company. The…
A: Given information- We have given the quality control data for a manufacturing process at Kensport…
Q: A study was made on the amount of converted sugar in a certain process at various temperatures. The…
A:
Q: Listed below are body temperatures from five different subjects measured at 8 AM and again at 12 AM.…
A: Let d = Temperature at 8AM (X) - Temperatures at 12 AM ( Y)
Q: Given are the scores of 10 employees from their 20-point assessment 16 18 10 8 12 15 19 17 16 7…
A:
Q: 4. The ages of students in a night class on gerontology were collected with the following results: X…
A: Confidence interval: The following is the formula for Confidence interval about true population…
Q: 3. Draw a histogram and locate mode from the following and verify with actual calculation. Class…
A:
Q: 2. The following are the weights (in grams) of 11 mineral samples obtained in the field trip in…
A:
Q: 1. What is the 40th percentile of the following measurement of oblique body length of mature cows…
A: Find 40th percentile= ?
Q: D. Which video streaming platform(s) has(have) the highest median time spent by its patrons? E.…
A: Given: Boxplots for the time spent in video streaming platforms.
Q: Given are the scores of 10 employees from their 20-point assessment 16 18 10 8 12 15 19 17 16 7…
A: Formula used for Decile and percentile . D7 =(7(n+1)/10)th P18 =(18(n+1)/100)th
Q: Given that n=82 data points are collected when studying the relationship between average daily…
A: It is given that sample size (n) is 82, and r is -0.974.Thus,The degree of freedom (df) is:
Q: The number of contaminating particles on a silicon wafer prior to a certain rinsing process was…
A: First let us find the relative frequencies. We know that the relative frequency is given by;…
Q: c) Identify the scale of measurement of the following variables- 1. years of service on a job. 2.…
A: 1. years of service on a job - Ratio (It is a discrete variable) 2. occupational prestige - Ordinal…
Q: 2. For the following information on a data set: Relative Freq .02 .01 Measurement Class .00- .75…
A: The relative frequencies of the measurement class are given.
Q: Given are the scores of 10 employees from their 20-point assessment 16 18 10 8 12 15 19 17 16 7…
A:
Q: State whether the following variables are nominal (N), ordinal (0), interval (I), or ratio (R). Your…
A: Continuous numerical data: The type of data that can take an uncountable or infinite number of…
Q: Listed below are body temperatures from five different subjects measured at 8 AM and again at 12 AM.…
A: Mean is the measure of central tendency. It is calculated by adding all the values and divided by…
Q: Given are data on average food consumption (g / kg body wt) of groups of tilapia , Oreochromis…
A: Whenever we want to study the difference between the average values of same subject…
Q: The number of contaminating particles on a silicon wafer prior to a certain rinsing process was…
A:
Q: The following are quality control data for a manufacturing process at Kensport Chemical Company. The…
A: Given information- We have given the quality control data for a manufacturing process at Kensport…
Q: Student X and Y decided to develop their skill in using the analytical balance. They tried measuring…
A: Grubbs’ test is used to test whether there is an existence of an outlier in a data set or not.
Q: Three sample observations taken for two variables are shown below: X (In $) (In ounces) 2.78 0.60…
A: We have to find variance, for comparing X and Y to check which varies the most. The variance is…
Q: The number of contaminating particles on a silicon wafer prior to a certain rinsing process was…
A:
Q: The following data was recorded by the student. S.N Temperature Humidity Yield 1 40 57 112 45 54 118…
A: Solution ) Regression equation is:
Q: Using Excel construct a scatter plot. Discuss the output of the scatter plot. Give (or calculate)…
A: Let X be the variable defined as price of the item and Y be the variable defined as time taken for…
Q: 2. A technician collected the following data after measuring the heights of a sample of plants that…
A: Use the given data to calculate the required quantities.
Q: Select the correct answer below: r is significant because it is between the positive and…
A: State the appropriate hypothesis:The hypotheses are given below:Null hypothesis:H0 : ρ = 0That is,…
Q: 1 Declare variables of the appropriate data type for the following parameters • Number of cars in a…
A: Number of cars in a parking lot- disrete variable price of items in a grocery shop - discrete…
Q: 5. The following data are direct solar (watts/m2) at intensity measurements a location in southern…
A: The question is about grouped frequency distribution Given : Starting first class interval = 450 -…
Q: Listed below are body temperatures from five different subjects measured at 8am and again at 12am.…
A:
Q: (3). Consider the following data of Marks. Calculate (1) All measure of Central tendencies (2) All…
A: First Calculate mid point for every class Interval. Measure of central tendency are mean, median…
Q: The following are quality control data for a manufacturing process at Kensport Chemical Company. The…
A: Quality is essential in all fields. Studying the quality using a statistical method is called…

Step by step
Solved in 3 steps with 2 images

- Spacers are manufactured to the mean dimension and tolerance shown in Figure 29-12. An inspector measures 10 spacers and records the following thicknesses: 0.372" 0.376" 0.379" 0.375" 0.370" 0.373" 0.377" 0.378" 0.371" 0.380" Which spacers are defective (above the maximum limit or below the minimum limit)? All dimensions are in inches.3. J.D. Power and Associates conducts vehicle quality surveys to provide automobile manufacturers with consumersatisfaction information about their products (Vehicle Quality Survey, January 2010). Using a sample of vehicleowners from recent vehicle purchase records, the survey asks the owners a variety of questions about their newvehicles, such as those shown below. For each question, state whether the data collected are categorical orquantitative and indicate the measurement scale being used.a. Did you purchase or lease the vehicle?b. What price did you pay for the vehicle?c. How likely would you be to recommend this vehicle to a friend? (Definitely Not, Probably Not, Probably Will,and Definitely Will)d. What is your overall rating of your new vehicle (Unacceptable, Average, Outstanding, or Truly Exceptional)?The following BTU measurements are taken relative to some chemical process: 1244, 1198, 1212, 1235, 1245, 1190, 1202, 1220, 1233, 1208. A problem with the process is indicated if the mean BTU measurement varies too greatly from 1230. Given the aforementioned data, the hypotheses H0: µ = 1230 and H1: µ ≠ 1230, and α = 0.05, do the data indicate a problem with the chemical process? a. As |-1.72| < 1.833, the data do not indicate a problem with the chemical process. b. As |-1.72| < 2.262, the data do not indicate a problem with the chemical process. c. As |-1.72| < 1.833, the data indicate a problem with the chemical process. d. As |-1.72| < 2.262, the data indicate a problem with the chemical process. e. As |-1.81| < 1.833, the data do not indicate a problem with the chemical process. f. As |-1.81| < 2.262, the data do not indicate a problem with the chemical process. g. As |-1.81| < 2.262, the data indicate a…
- In each of the following situations, identify the scale(s) ofmeasurement that is appropriate for each situation. (i) A visiting school inspector asked a class teacher to rank thethirty students in her class on “level of discipline”, with 1 standingfor the least disciplined student and 30 standing for the most 3 disciplined student.(ii) Identical twins living in different environments are beingcompared to find out the influence of the environment on theiracademic performance. A standard test on academic performance isgiving to fifty (50) sets of identical twins and their performancegraded over 100. (iii) “Regular” students and students admitted under thedistance learning programme into Accra Institute ofTechnology are administrated a questionnairemeasuring “level of maturity” of the students, withscores on “level of maturity” ranging from 0 to 10. (iv) One thousand students in a statistics class are asked torate their lecturer on teaching effectiveness at the end ofthe…Use the following Frequency table to calculate the standerd deviation. Class Frequency 2……4 4 5……7 6 8…….10 3 11…..13 2 14…..16 5Please answer the following: Thank you. A study was conducted on levels of PBC in soil samples in both rural and urban areas with the following results in PPM units: Rural: 3.5 1.0 1.6. 12.0 8.1 5.3 23.0 8.2 1.8 9.8 1.5 9.7 9.0 Urban: 24.0 11.0 107.0 18.0 29.0 49.0 94.0 12.0 16.0 22.0 141.0 18.0 21.0 13.0 11.0. Construct two boxplots, one for rural and one for urban. Write a paragraph comparing the two distributions.
- The accompanying summary data on total cholesterol level (mmol/l) was obtained from a sample of Asian postmenopausal women who were vegans and another sample of such women who were omnivores. Diet Sample Size Sample Mean Sample SD Vegan 86 5.30 1.02 Omnivore 93 5.75 1.20 Calculate a 99% CI for the difference between population mean total cholesterol level for vegans and population mean total cholesterol level for omnivores. (Use ?Vegan − ?Omnivore. Round your answers to three decimal places.) , (mmol/l) Interpret the interval. We are 99% confident that the true average cholesterol level for vegans is greater than that of omnivores by an amount within the confidence interval.We are 99% confident that the true average cholesterol level for vegans is less than that of omnivores by an amount within the confidence interval. We are 99% confident that the true average cholesterol level for vegans is greater than that of omnivores by an amount outside…3. As part of the National Health and Nutrition Examination Survey, the Department of Health andHuman Services obtained self-reported heights and measured the heights for males aged 12-16. Allmeasurements are in inches. Is there a difference between the reported height vs. the measured height?Use a 0.05 level of significance.ReportedHeight68 71 63 71 71 60 65 64 54 63 66 72MeasuredHeight67.9 69.9 64.9 68.3 70.3 60.6 64.5 67.0 55.6 74.2 65.0 70.8DifferenceNull and alternative hypothesis (give both in symbolic form and sentence form):Test statistic and p-value (show the calculation or show what you entered into the calculator (screenshotsare ok here)):Technical conclusion, circle one: reject the null hypothesis or fail to reject the null hypothesisWhy did you choose to reject or fail to reject the null hypothesis?Nontechnical conclusion addressing the original claim:There is a relationship between political affiliation (on a scale of 1 to 10, where 1 = very liberal and 10 = very conservative) and U.S. geographic regions, such that people living in the Northeast are more likely to consider themselves liberal than people living in the South. what is my unit of analysis?
- Given the measurements 20, 26, 40, 39, 25, 36, and 34, compute for the following: 1. Mean 2. range 3.P25 4. mean deviation 5. standard deviationIndicate which level of measurement is being used in the given scenario. 1. The teacher of a class records the eye color of each student. 2. The teacher of a class records the letter grade for mathematics for each student. 3. The teacher of a class records the percentage that each student got correct on the last science test. 4. A meteorologist compiles a list of temperatures in degrees Celsius for the month of May 5. A film critic lists the top 50 greatest movies of all time 6. A car magazine lists the most expensive cars for 2017To assess the air quality in a surgical suite, the presence of colony-forming spores per cubic meter of air is measured on three successive days. The results are as follows: {12, 24, 30}. Calculate the mean and standard deviation for these data.