The number of contaminating particles on a silicon wafer prior to a certain rinsing process was determined for each wafer in a sample of size 100, resulting in the following frequencies: Number of particles Frequency 0 1 2 3 4 5 6 7 8 9 10 11 12 13 14 1 2 3 12 11 15 15 10 14 4 5 3 2 2 1 LAUSE SALT (a) What proportion of the sampled wafers had at least one particle? At least five particles? (Round your answers to two decimal places.) at least one particle at least five particles (b) What proportion of the sampled wafers had between five and ten particles, inclusive? Strictly between five and ten particles? (Round your answers to two decimal places.) between five and ten particles, inclusive strictly between five and ten particles (c) Draw a histogram/bar chart using relative frequency on the vertical axis. Percent Percent 15 15 10 10 3 3 Hom Number 0 1 2 3 4 5 6 7 8 9 1011121314 0 1 2 3 4 5 6 7 8 9 1011121314 01234567891011121314 0 1 2 3 4 5 6 7 8 9 1011121314 How would you describe the shape of the histogram? O The histogram is negatively skewed and bimodal. O The histogram is fairly symmetric and bimodal. The histogram is negatively skewed and unimodal. O The histogram is positively skewed and bimodal. O The histogram is positively skewed and unimodal. O The histogram is fairly symmetric and unimodal. Percent 13 10 Number Percent 15 10 O Number Number
The number of contaminating particles on a silicon wafer prior to a certain rinsing process was determined for each wafer in a sample of size 100, resulting in the following frequencies: Number of particles Frequency 0 1 2 3 4 5 6 7 8 9 10 11 12 13 14 1 2 3 12 11 15 15 10 14 4 5 3 2 2 1 LAUSE SALT (a) What proportion of the sampled wafers had at least one particle? At least five particles? (Round your answers to two decimal places.) at least one particle at least five particles (b) What proportion of the sampled wafers had between five and ten particles, inclusive? Strictly between five and ten particles? (Round your answers to two decimal places.) between five and ten particles, inclusive strictly between five and ten particles (c) Draw a histogram/bar chart using relative frequency on the vertical axis. Percent Percent 15 15 10 10 3 3 Hom Number 0 1 2 3 4 5 6 7 8 9 1011121314 0 1 2 3 4 5 6 7 8 9 1011121314 01234567891011121314 0 1 2 3 4 5 6 7 8 9 1011121314 How would you describe the shape of the histogram? O The histogram is negatively skewed and bimodal. O The histogram is fairly symmetric and bimodal. The histogram is negatively skewed and unimodal. O The histogram is positively skewed and bimodal. O The histogram is positively skewed and unimodal. O The histogram is fairly symmetric and unimodal. Percent 13 10 Number Percent 15 10 O Number Number

MATLAB: An Introduction with Applications
6th Edition
ISBN:9781119256830
Author:Amos Gilat
Publisher:Amos Gilat
Chapter1: Starting With Matlab
Section: Chapter Questions
Problem 1P

Related questions
Question
PQ4
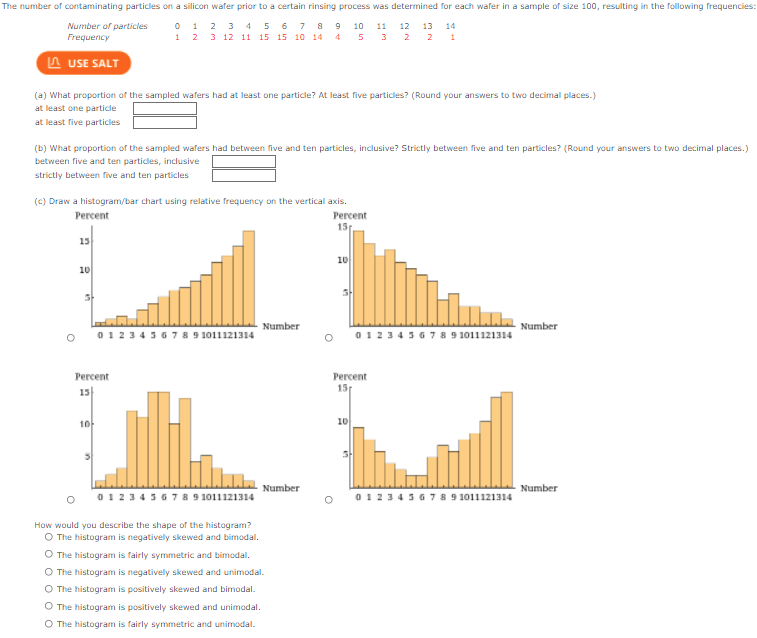
Transcribed Image Text:The number of contaminating particles on a silicon wafer prior to a certain rinsing process was determined for each wafer in a sample of size 100, resulting in the following frequencies:
Number of particles
Frequency
0 1 2 3 4 5 6 7 8 9 10 11 12 13 14
1 2 3 12 11 15 15 10 14 4 5 3 2 2 1
LAUSE SALT
(a) What proportion of the sampled wafers had at least one particle? At least five particles? (Round your answers to two decimal places.)
at least one particle
at least five particles
(b) What proportion of the sampled wafers had between five and ten particles, inclusive? Strictly between five and ten particles? (Round your answers to two decimal places.)
between five and ten particles, inclusive
strictly between five and ten particles
(c) Draw a histogram/bar chart using relative frequency on the vertical axis.
Percent
Percent
15
15
10
10
3
3
Hom
Number
0 1 2 3 4 5 6 7 8 9 1011121314
0 1 2 3 4 5 6 7 8 9 1011121314
01234567891011121314
0 1 2 3 4 5 6 7 8 9 1011121314
How would you describe the shape of the histogram?
O The histogram is negatively skewed and bimodal.
O The histogram is fairly symmetric and bimodal.
The histogram is negatively skewed and unimodal.
O The histogram is positively skewed and bimodal.
O
The histogram is positively skewed and unimodal.
O The histogram is fairly symmetric and unimodal.
Percent
13
10
Number
Percent
15
10
O
Number
Number
Expert Solution
This question has been solved!
Explore an expertly crafted, step-by-step solution for a thorough understanding of key concepts.

This is a popular solution!

Trending now
This is a popular solution!

Step by step
Solved in 4 steps with 3 images

Recommended textbooks for you
MATLAB: An Introduction with Applications
Statistics
ISBN:
9781119256830
Author:
Amos Gilat
Publisher:
John Wiley & Sons Inc

Probability and Statistics for Engineering and th…
Statistics
ISBN:
9781305251809
Author:
Jay L. Devore
Publisher:
Cengage Learning

Statistics for The Behavioral Sciences (MindTap C…
Statistics
ISBN:
9781305504912
Author:
Frederick J Gravetter, Larry B. Wallnau
Publisher:
Cengage Learning
MATLAB: An Introduction with Applications
Statistics
ISBN:
9781119256830
Author:
Amos Gilat
Publisher:
John Wiley & Sons Inc
Probability and Statistics for Engineering and th…
Statistics
ISBN:
9781305251809
Author:
Jay L. Devore
Publisher:
Cengage Learning
Statistics for The Behavioral Sciences (MindTap C…
Statistics
ISBN:
9781305504912
Author:
Frederick J Gravetter, Larry B. Wallnau
Publisher:
Cengage Learning

Elementary Statistics: Picturing the World (7th E…
Statistics
ISBN:
9780134683416
Author:
Ron Larson, Betsy Farber
Publisher:
PEARSON

The Basic Practice of Statistics
Statistics
ISBN:
9781319042578
Author:
David S. Moore, William I. Notz, Michael A. Fligner
Publisher:
W. H. Freeman

Introduction to the Practice of Statistics
Statistics
ISBN:
9781319013387
Author:
David S. Moore, George P. McCabe, Bruce A. Craig
Publisher:
W. H. Freeman