The number of contaminating particles on a silicon wafer prior to a certain rinsing process was determined for each wafer in a sample of size 100, resulting in the following frequencies: Number of particles 0 1 2 3 4 5 6 7 8 9 10 11 12 13 14 Frequency 1 3 3 12 11 15 16 10 12 4 5 3 2 2 1 (a) What proportion of the sampled wafers had at least one particle? At least five particles? (Round your
The number of contaminating particles on a silicon wafer prior to a certain rinsing process was determined for each wafer in a sample of size 100, resulting in the following frequencies: Number of particles 0 1 2 3 4 5 6 7 8 9 10 11 12 13 14 Frequency 1 3 3 12 11 15 16 10 12 4 5 3 2 2 1 (a) What proportion of the sampled wafers had at least one particle? At least five particles? (Round your

Mathematics For Machine Technology
8th Edition
ISBN:9781337798310
Author:Peterson, John.
Publisher:Peterson, John.
Chapter29: Tolerance, Clearance, And Interference
Section: Chapter Questions
Problem 16A: Spacers are manufactured to the mean dimension and tolerance shown in Figure 29-12. An inspector...

Related questions
Question
100%
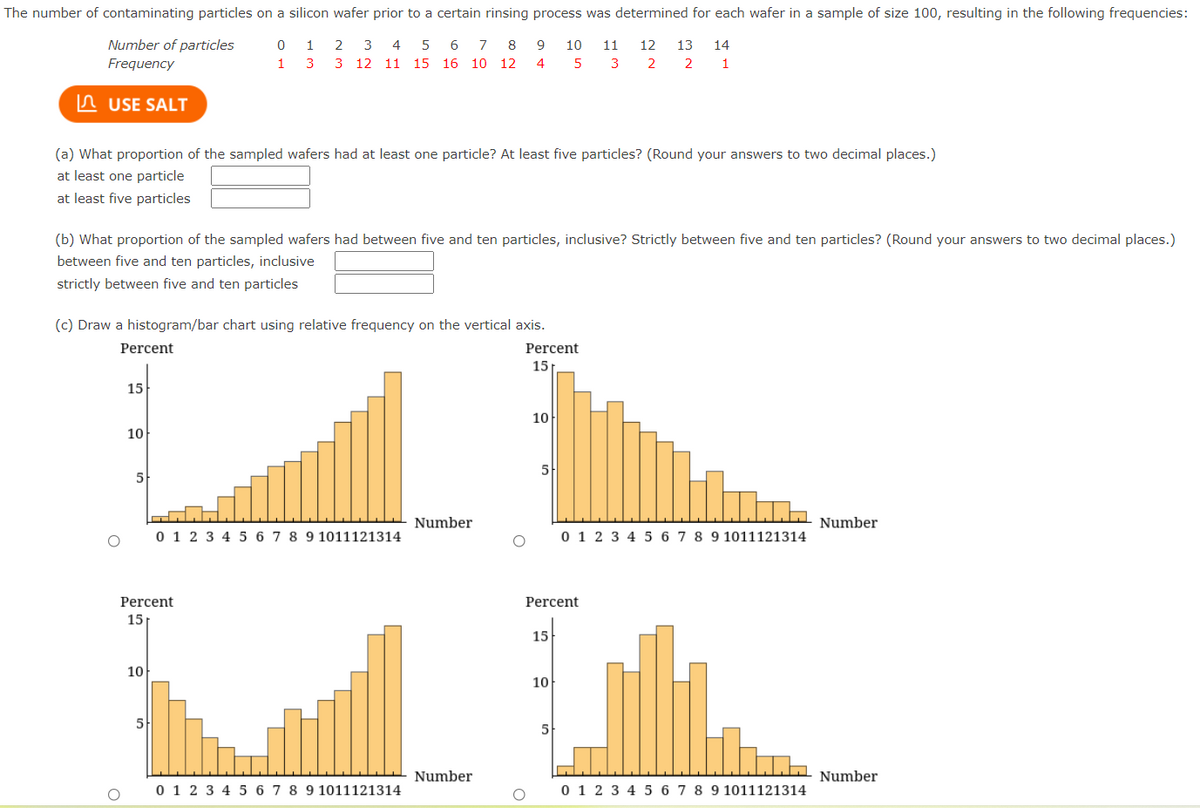
The number of contaminating particles on a silicon wafer prior to a certain rinsing process was determined for each wafer in a sample of size 100, resulting in the following frequencies:
| Number of particles | 0 | 1 | 2 | 3 | 4 | 5 | 6 | 7 | 8 | 9 | 10 | 11 | 12 | 13 | 14 |
| Frequency | 1 | 3 | 3 | 12 | 11 | 15 | 16 | 10 | 12 | 4 | 5 | 3 | 2 | 2 | 1 |
(a) What proportion of the sampled wafers had at least one particle? At least five particles? (Round your answers to two decimal places.)
(b) What proportion of the sampled wafers had between five and ten particles, inclusive? Strictly between five and ten particles? (Round your answers to two decimal places.)
(c) Draw a histogram/bar chart using relative frequency on the vertical axis.
| at least one particle | |
| at least five particles |
(b) What proportion of the sampled wafers had between five and ten particles, inclusive? Strictly between five and ten particles? (Round your answers to two decimal places.)
| between five and ten particles, inclusive | |
| strictly between five and ten particles |
(c) Draw a histogram/bar chart using relative frequency on the vertical axis.
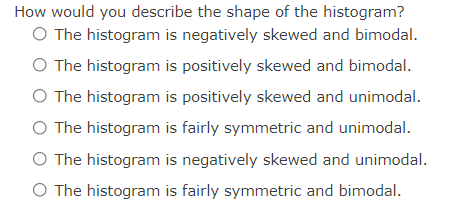
How would you describe the shape of the histogram?
The histogram is negatively skewed and bimodal.The histogram is positively skewed and bimodal. The histogram is positively skewed and unimodal.The histogram is fairly symmetric and unimodal.The histogram is negatively skewed and unimodal.The histogram is fairly symmetric and bimodal.
Transcribed Image Text:How would you describe the shape of the histogram?
O The histogram is negatively skewed and bimodal.
O The histogram is positively skewed and bimodal.
O The histogram is positively skewed and unimodal.
O The histogram is fairly symmetric and unimodal.
O The histogram is negatively skewed and unimodal.
O The histogram is fairly symmetric and bimodal.
Transcribed Image Text:The number of contaminating particles on a silicon wafer prior to a certain rinsing process was determined for each wafer in a sample of size 100, resulting in the following frequencies:
Number of particles
0 1
2
3 4 5 6
8
9
10
11
12
13
14
Frequency
1 3
3 12 11 15 16 10
12
4
3
2
2
1
In USE SALT
(a) What proportion of the sampled wafers had at least one particle? At least five particles? (Round your answers to two decimal places.)
at least one particle
at least five particles
(b) What proportion of the sampled wafers had between five and ten particles, inclusive? Strictly between five and ten particles? (Round your answers to two decimal places.)
between five and ten particles, inclusive
strictly between five and ten particles
(c) Draw a histogram/bar chart using relative frequency on the vertical axis.
Percent
Percent
15
15
10
10
5
Number
Number
0 1 2 3 4 5 6 7 8 9 1011121314
0 1 2 3 4 5 6 7 8 9 1011121314
Percent
Percent
15
15
10
10
5
Number
Number
0 1 2 3 4 5 6 7 8 9 1011121314
0 1 2 3 4 5 6 7 8 9 1011121314
Expert Solution
This question has been solved!
Explore an expertly crafted, step-by-step solution for a thorough understanding of key concepts.

This is a popular solution!

Trending now
This is a popular solution!

Step by step
Solved in 2 steps with 2 images

Recommended textbooks for you
Mathematics For Machine Technology
Advanced Math
ISBN:
9781337798310
Author:
Peterson, John.
Publisher:
Cengage Learning,

Glencoe Algebra 1, Student Edition, 9780079039897…
Algebra
ISBN:
9780079039897
Author:
Carter
Publisher:
McGraw Hill
Mathematics For Machine Technology
Advanced Math
ISBN:
9781337798310
Author:
Peterson, John.
Publisher:
Cengage Learning,
Glencoe Algebra 1, Student Edition, 9780079039897…
Algebra
ISBN:
9780079039897
Author:
Carter
Publisher:
McGraw Hill