1. Working with Numbers and Graphs Q1 Suppose the marginal costs of reading are constant at $14 per hour, while the marginal benefits of reading decline (over time) as more reading is performed. In particular, suppose the following table contains the marginal benefit associated with various levels of hours spent reading. Time Spent Reading Marginal Benefits (Hours) (Dollars per hour) 10 16 40 4. Assume the marginal-benefit curve is a straight line through the two points described in the table. On the following graph, use the blue points (circle symbol) to plot the marginal-benefit curve for reading. Next, use the orange points (square symbol) to plot the marginal-cost curve for reading. Finally, use the black point (plus symbol) to indicate the point corresponding to the efficient amount of reading (that is, the point at which the net benefits of reading are maximized).
1. Working with Numbers and Graphs Q1 Suppose the marginal costs of reading are constant at $14 per hour, while the marginal benefits of reading decline (over time) as more reading is performed. In particular, suppose the following table contains the marginal benefit associated with various levels of hours spent reading. Time Spent Reading Marginal Benefits (Hours) (Dollars per hour) 10 16 40 4. Assume the marginal-benefit curve is a straight line through the two points described in the table. On the following graph, use the blue points (circle symbol) to plot the marginal-benefit curve for reading. Next, use the orange points (square symbol) to plot the marginal-cost curve for reading. Finally, use the black point (plus symbol) to indicate the point corresponding to the efficient amount of reading (that is, the point at which the net benefits of reading are maximized).

Chapter1: What Economics Is About
Section: Chapter Questions
Problem 1WNG

Related questions
Question
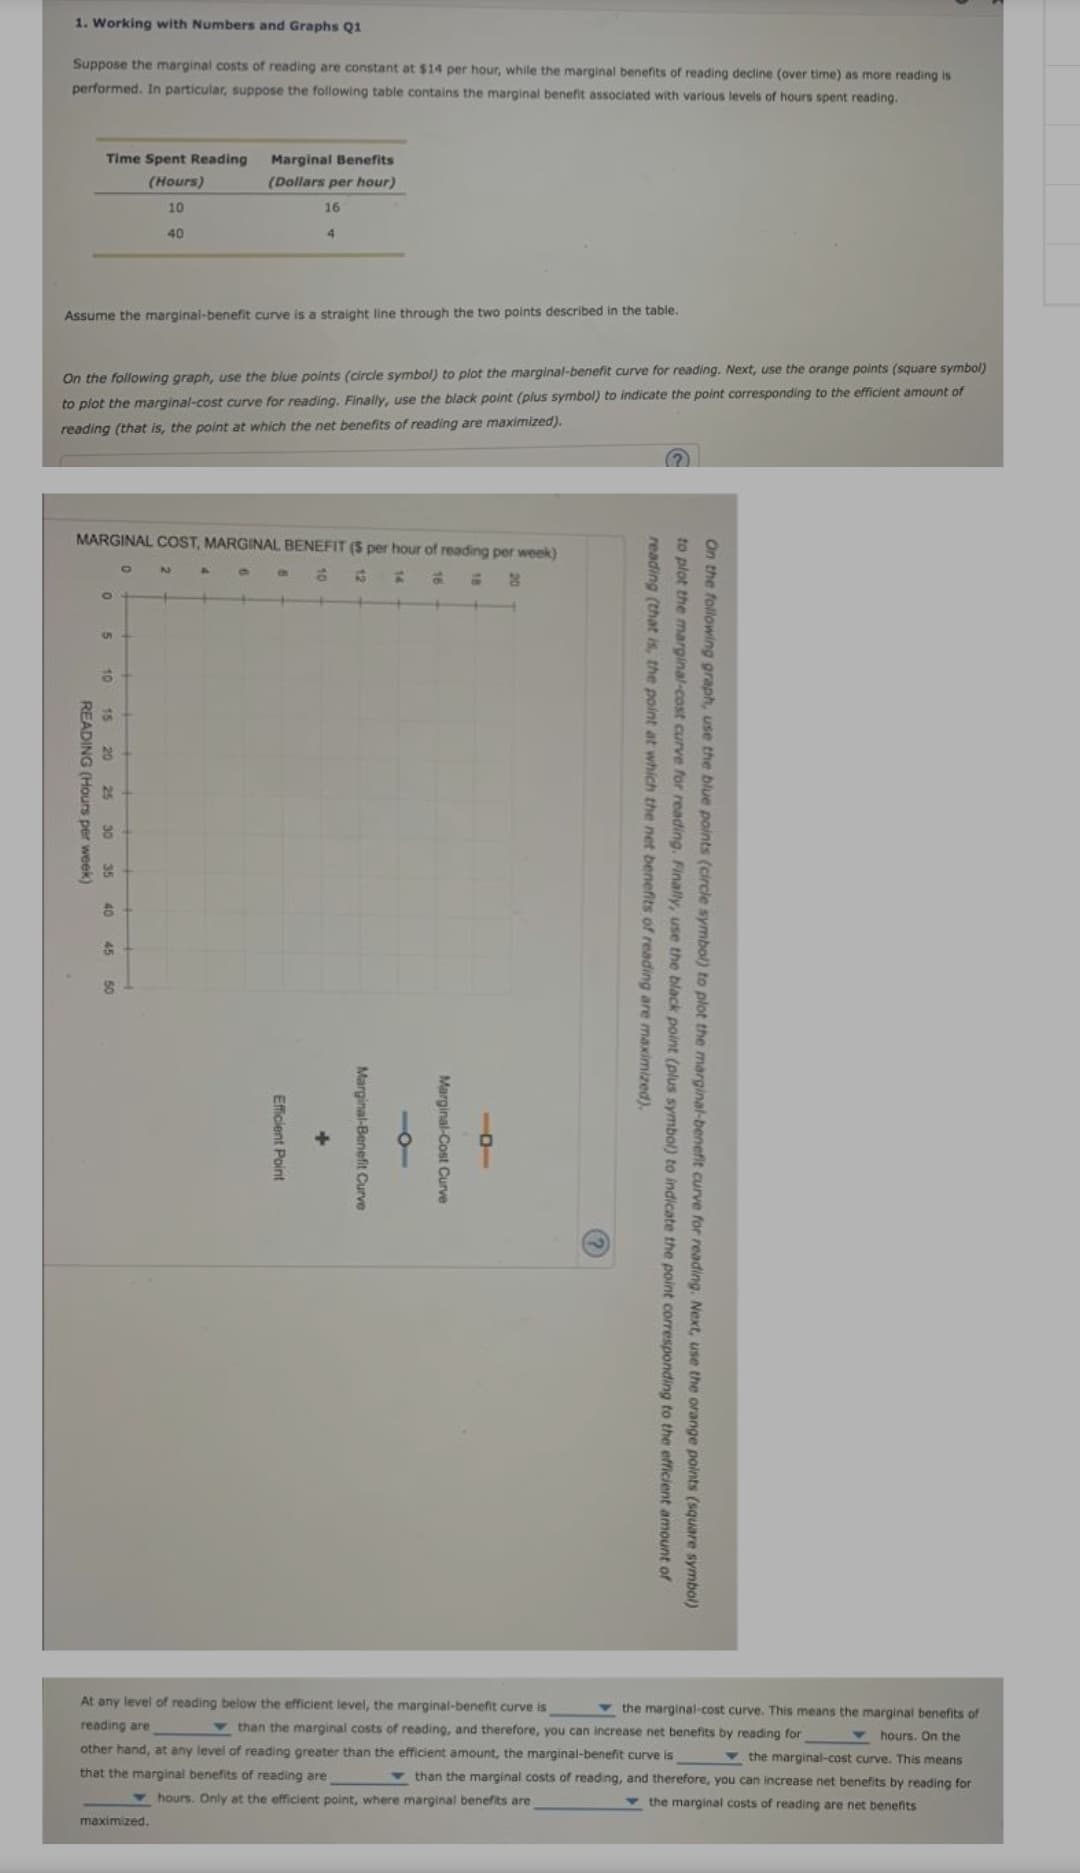
Transcribed Image Text:1. Working with Numbers and Graphs Q1
Suppose the marginal costs of reading are constant at $14 per hour, while the marginal benefits of reading decline (over time) as more reading is
performed. In particular, suppose the following table contains the marginal benefit associated with various levels of hours spent reading.
Time Spent Reading
Marginal Benefits
(Hours)
(Dollars per hour)
10
16
40
4.
Assume the marginal-benefit curve is a straight line through the two points described in the table.
On the following graph, use the blue points (circle symbol) to plot the marginal-benefit curve for reading. Next, use the orange points (square symbol)
to plot the marginal-cost curve for reading. Finally, use the black point (plus symbol) to indicate the point corresponding to the efficient amount of
reading (that is, the point at which the net benefits of reading are maximized).
MARGINAL COST, MARGINAL BENEFIT (S per hour of reading per week)
10
12
14
20
10
At any level of reading below the efficient level, the marginal-benefit curve is
v the marginal-cost curve. This means the marginal benefits of
reading are
v than the marginal costs of reading, and therefore, you can increase net benefits by reading for
v hours. On the
other hand, at any level of reading greater than the efficient amount, the marginal-benefit curve is
v the marginal-cost curve. This means
v than the marginal costs of reading, and therefore, you can increase net benefits by reading for
that the marginal benefits of reading are
v hours. Only at the efficient point, where marginal benefits are
v the marginal costs of reading are net benefits
maximized,
On the following graph, use the blue points (circle symbol) to plot the marginal-benefit curve for reading. Next, use the orange points (square symbol)
to plot the marginal-cost curve for reading. Finally, use the black point (plus symbol) to indicate the point corresponding to the efficient amount of
reading (that is, the point at which the net benefits of reading are maximized).
Marginal-Cost Curve
-0-
Marginal-Benefit Curve
Efficient Point
15 20 25
35
40
45 50
30
READING (Hours per week)
Expert Solution
This question has been solved!
Explore an expertly crafted, step-by-step solution for a thorough understanding of key concepts.

This is a popular solution!

Trending now
This is a popular solution!

Step by step
Solved in 2 steps with 1 images

Knowledge Booster


Learn more about
Need a deep-dive on the concept behind this application? Look no further. Learn more about this topic, economics and related others by exploring similar questions and additional content below.Recommended textbooks for you

Economics (MindTap Course List)
Economics
ISBN:
9781337617383
Author:
Roger A. Arnold
Publisher:
Cengage Learning

Principles of Economics 2e
Economics
ISBN:
9781947172364
Author:
Steven A. Greenlaw; David Shapiro
Publisher:
OpenStax
Economics (MindTap Course List)
Economics
ISBN:
9781337617383
Author:
Roger A. Arnold
Publisher:
Cengage Learning
Principles of Economics 2e
Economics
ISBN:
9781947172364
Author:
Steven A. Greenlaw; David Shapiro
Publisher:
OpenStax

Essentials of Economics (MindTap Course List)
Economics
ISBN:
9781337091992
Author:
N. Gregory Mankiw
Publisher:
Cengage Learning

Principles of Economics (MindTap Course List)
Economics
ISBN:
9781305585126
Author:
N. Gregory Mankiw
Publisher:
Cengage Learning

Principles of Microeconomics (MindTap Course List)
Economics
ISBN:
9781305971493
Author:
N. Gregory Mankiw
Publisher:
Cengage Learning