Suppose a random sample of 48 apartments in Toronto was selected and their square footage were recorded. (a) We would like to construct a confidence interval to estimate the true mean square footage of apartments in Toronto. A histogram of the apartment sizes in our sample is as follows: 5 550 600 650 700 750 800 850 900 Square footage What is the shape of the data distribution? We want to construct a confidence interval that relies on the assumption of normality, Given that it does not appear that the apartment square footages followa normal distribution, can we still meaningfully construct this interval? Why or why not? (b) The mean and standard deviation of the apartments in the sample are calculated to be 660.94 and 79.88 respectively. Construct a 98% confidence interval for the true mean square footage of apartments in Toronto, (c) Provide an interpretation of the interval calculated in (b). Frequency 15
Suppose a random sample of 48 apartments in Toronto was selected and their square footage were recorded. (a) We would like to construct a confidence interval to estimate the true mean square footage of apartments in Toronto. A histogram of the apartment sizes in our sample is as follows: 5 550 600 650 700 750 800 850 900 Square footage What is the shape of the data distribution? We want to construct a confidence interval that relies on the assumption of normality, Given that it does not appear that the apartment square footages followa normal distribution, can we still meaningfully construct this interval? Why or why not? (b) The mean and standard deviation of the apartments in the sample are calculated to be 660.94 and 79.88 respectively. Construct a 98% confidence interval for the true mean square footage of apartments in Toronto, (c) Provide an interpretation of the interval calculated in (b). Frequency 15

Glencoe Algebra 1, Student Edition, 9780079039897, 0079039898, 2018
18th Edition
ISBN:9780079039897
Author:Carter
Publisher:Carter
Chapter4: Equations Of Linear Functions
Section: Chapter Questions
Problem 8SGR

Related questions
Question
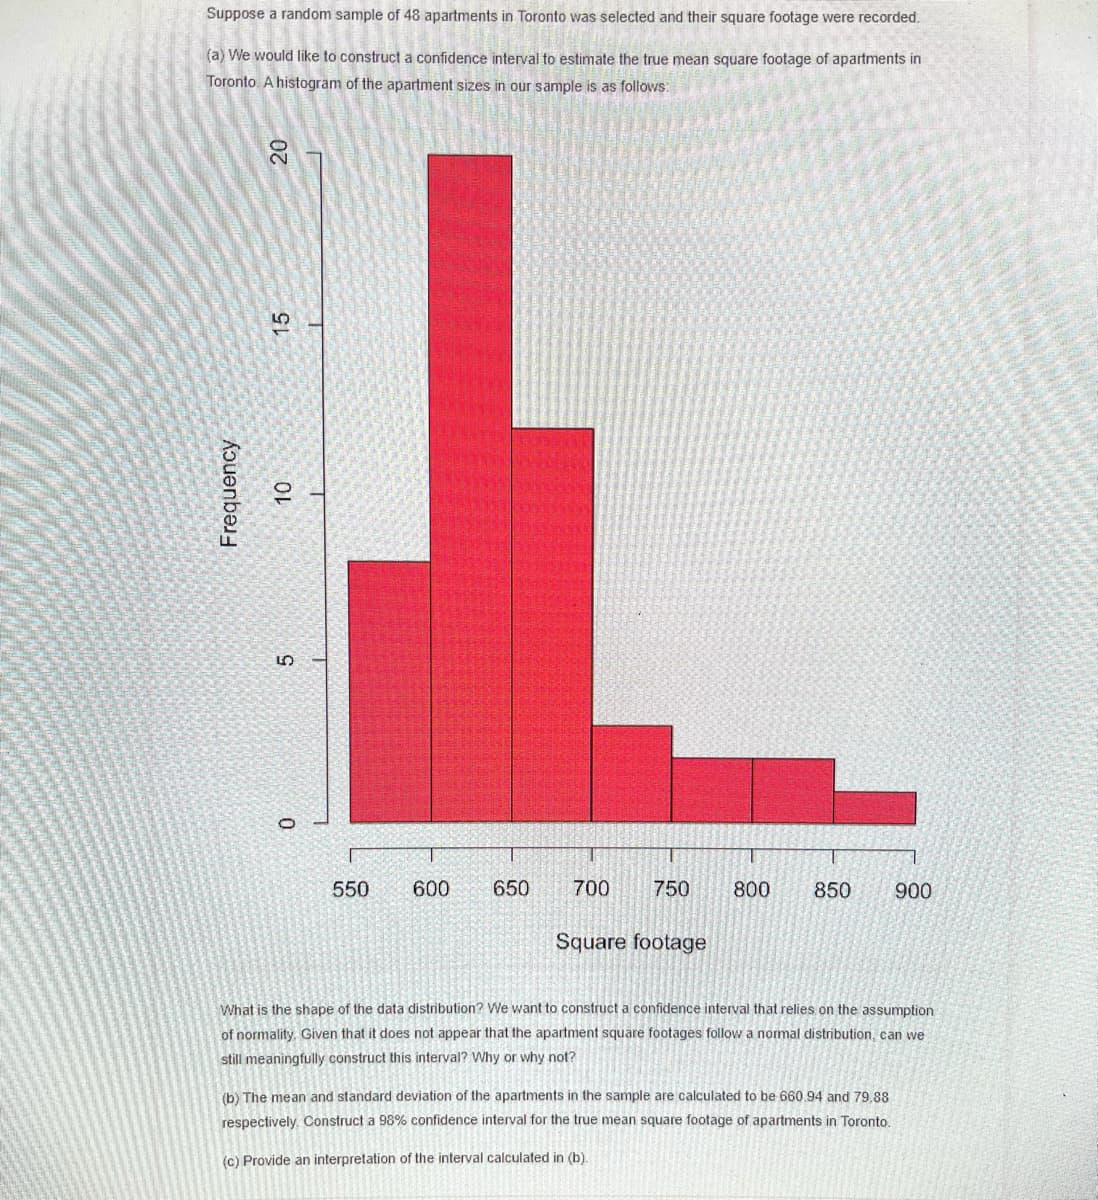
Transcribed Image Text:Suppose a random sample of 48 apartments in Toronto was selected and their square footage were recorded.
(a) We would like to construct a confidence interval to estimate the true mean square footage of apartments in
Toronto. A histogram of the apartment sizes in our sample is as follows:
LO
550
600
650
700
750
800
850
900
Square footage
What is the shape of the data distribution? We want to construct a confidence interval that relies on the assumption
of normality. Given that it does not appear that the apartment square footages follow a normal distribution, can we
still meaningfully construct this interval? Why or why not?
(b) The mean and standard deviation of the apartments in the sample are calculated to be 660.94 and 79.88
respectively. Construct a 98% confidence interval for the true mean square footage of apartments in Toronto.
(c) Provide an interpretation of the interval calculated in (b).
Frequency
15
Expert Solution
This question has been solved!
Explore an expertly crafted, step-by-step solution for a thorough understanding of key concepts.

Step by step
Solved in 4 steps with 5 images

Recommended textbooks for you
Glencoe Algebra 1, Student Edition, 9780079039897…
Algebra
ISBN:
9780079039897
Author:
Carter
Publisher:
McGraw Hill

College Algebra (MindTap Course List)
Algebra
ISBN:
9781305652231
Author:
R. David Gustafson, Jeff Hughes
Publisher:
Cengage Learning
Glencoe Algebra 1, Student Edition, 9780079039897…
Algebra
ISBN:
9780079039897
Author:
Carter
Publisher:
McGraw Hill
College Algebra (MindTap Course List)
Algebra
ISBN:
9781305652231
Author:
R. David Gustafson, Jeff Hughes
Publisher:
Cengage Learning