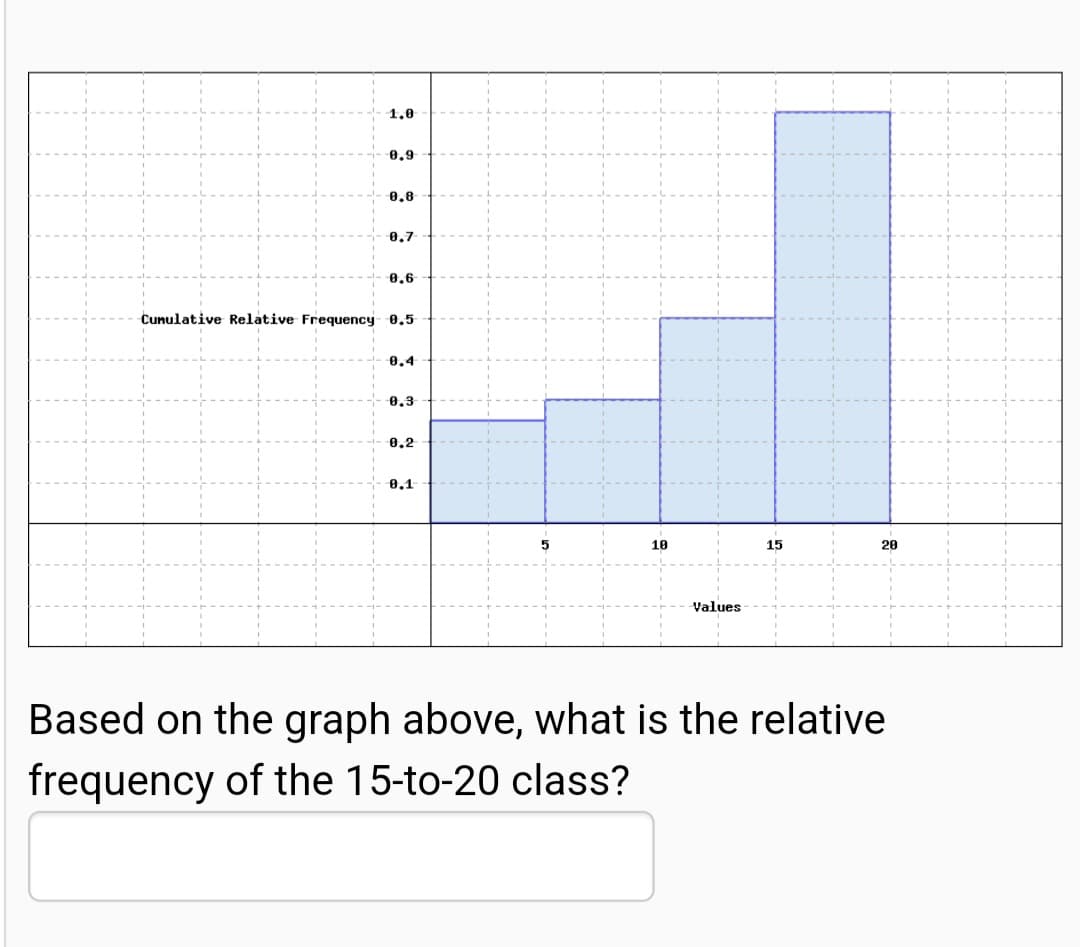
1.0 0,9 0.8 8,7 8,6 Cunulative Relative Frequency- 0,5 8.4 8,3 0.2 8,1 10 15 20 Values Based on the graph above, what is the relative frequency of the 15-to-20 class?


Q: Display the information in the table in a relative frequency bar graph
A: Now , Relative frequency=Class frequency/Total frequency The table for relative frequency is given…
Q: What is the class width? O A. the difference between the largest frequency and the smallest…
A: The “class width” is the distance between the lower limits of consecutive classes.
Q: A. Should the researcher conclude that there is a significant relation between birth order and…
A: A. The test is that there is a significant relation between birth order and personality or not. The…
Q: A frequency table of grades has five classes (A, B, C, D, F) with frequencies of 5, 10, 17,…
A: The given table is Grade Frequency A 5 B 10 C 17 D 5 F 3
Q: A) from the bellow table find the Mean? En=37 Classes 1-6 7-12 13-18 19-24 25-30 31-36 37-42…
A:
Q: A group of students were surveyed about the number of siblings they have. The frequencies and…
A: Solution: From the given information, the table of frequencies and relative frequencies of their…
Q: 1. The frequency table tallies the number of students at each VALUE for Level. What do you notice…
A: Mode : In a set of information values, the mode is that the worth that seems the foremost…
Q: Ages Number of students 15-18 7 19-22 2 23-26 10 27-30 7 31-34 2 35-38 2 Based on the frequency…
A:
Q: Ages Number of students 15-18 4. 19-22 10 23-26 10 27-30 31-34 35-38 Based on the frequency…
A: From the given table, The total frequency is 4+10+10+6+8+5=43 The frequency value for the class with…
Q: Among fatal plane crashes that occurred during the past 50 years, 490 were due to pilot error, 77…
A:
Q: (i) Construct a table to clearly show your class boundaries and cumulative frequency. (ii) Construct…
A: Data is given for Annual salary and number of graduates. We have to calculate class boundaries,…
Q: The following is a list of P/E ratios (current stock price divided by company's earnings per share)…
A: Given that - The filming isant of /e otios Écurrent stacie price divided by company's warnings per…
Q: What is the relative frequency for the class interval 27-30? Class Interval f 39 – 42 4 35 – 38 6.…
A: Class interval frequency (f) 39 -42 4 35 -38 6 31-34 12 27-30 5 23-26 4 19 -22 9
Q: A cell phone manufacturer makes cell phones, where 8 out of 6 are defective. What is the frequency…
A:
Q: 1500 1400 1300 1200 1100 English Mathematics 1000 900 800 700 600 500 400 300 200 100 10 20 30 40 50…
A: The Median is the mid point of the value. The median is the second quartile. The mid point of the…
Q: Ages Number of students 15-18 7 19-22 10 23-26 4 27-30 2 31-34 7 35-38 5 Based on the frequency…
A:
Q: A researcher is interested in the relationship between birth order and personality. A sample of n =…
A: Hi! Thank you for the question, As per the honor code, we are allowed to answer one question at a…
Q: Ages Number of students 15-18 2 19-22 4 23-26 3 27-30 7 31-34 6 35-38 10 Based on the frequency…
A: Solution-: We have following table: Ages # of students 15-18 2 19-22 4 23-26 3 27-30 7…
Q: Which of the following statements is true regarding a frequency distribution table?
A: Frequency Distribution Table A frequency distribution table is a chart that summarizes all the data…
Q: The figure below shows the histogram of the numeric frequency distribution for shoppers' ages 12+ 9.…
A: Given, The given histogram represents the numeric frequency distribution for shopper’s ages.
Q: Ages Number of students 15-18 3 19-22 7 23-26 10 27-30 5 31-34 3 35-38 8 Based on the frequency…
A:
Q: Jais per 5. The points for drawing More Than Ogive curve are (10, 65), (20, 62), (30, 47), (40, 39),…
A: In a more than ogive curve the frequency for the first class is same as of the cumulative frequency.…
Q: 2.1 An'instructor obtained the following set of scores from a 10-point quiz for a cdass of 26…
A: Given the set of scores from 10 point quiz for a class of 26 student. Scores: 8, 5, 4, 5, 5, 7, 6,…
Q: How to complete a Frequency Distribution table and the class width with the information provided .…
A: Given values are17,19,13,21,11,59,16,10,33,24,30,42,58,19,15,18,22,28,32,29,25,35,22,18
Q: I have the data below to develop a frequency table: How would I would determine the number of…
A: Number of classes: Here, number of observations, n is 29. Consider the number of classes as 5. Using…
Q: Ages Number of students 15-18 10 19-22 8 23-26 10 27-30 2 31-34 6 35-38 7 Based on the frequency…
A: Given data, Find relative frequency for class with lower limit 15.
Q: A survey of adult men and women asked, "Which one of the following jobs would you most like to…
A: The relative frequency is simply given by rf = (favorable frequency)/(total frequency) Job Men…
Q: Ages Number of students 15-18 7 19-22 10 23-26 3 27-30 4 31-34 3 35-38 6 Based on the frequency…
A:
Q: BI Add the midpoint of each class, the relative frequency, percentage frequency, and the cumulative…
A: Let us notation Cf=Cumulative Frequency F=frequency CI=Class interval
Q: If the number 3 were added to the set {2,3,3,3,4,5,5)), which central tendency would change? O Mode…
A:
Q: The following is a list of P/E ratios (current stock price divided by company's earnings per share)…
A: It is an important part of statistics . It is widely used .
Q: 1. Mr. Ali, working as a sales man collected the details of the amount of money spent by 50…
A: Frequency distribution: In statistics, a frequency distribution is a list, table that contains the…
Q: Someone interested in the number of miles Prof. St. John has run each day preparing for her next…
A:
Q: Sixty adults with gum disease were asked the number of times per week they used to floss before…
A: Given, 60 adults with gum disease were asked the no of time per week they used to floss before their…
Q: pediatrician wants to determine the relation that may exist between a child's height and head…
A: Given Data : X = Height Y = Head Circumference 27 17.5 25…
Q: What is the class width of the following class intervals taken from a frequency distribution? 11 –…
A: It just subtraction of numbers.
Q: The data set below provides the monthly rent (in dollars) paid by 7 tenants.…
A: The monthly rent (in dollars) paid by 7 tenants are, 990, 879, 940, 1010, 950, 920 and 1430. The…
Q: What is the sum of the three missing values in the table below? > cf Class Intervals Frequency Class…
A:
Q: 2 6. 7 3 3 9 8 9 2 2 6 9 4 2 1 1 4 Q. 4: Is this possible to draw Pie chart on the data used in Q3,…
A: Pie chart is the graph which is a visual representation of the data into a circular graph and every…
Q: What is the sum of the three missing values in the table below? > cf Class Intervals Frequency Class…
A:
Q: Ages Number of students 15-18 9 19-22 7 23-26 4 27-30 7 31-34 8 35-38 10 Based on the frequency…
A: The frequency for the class with lower class limit 23 is 4 and the total frequency is 45.
Q: 55 30 50 15 2 Speed of Highway Drivers 60 50 40 30 20 10 50 55 60 65 70 75 80 85 Speed (in mph) a.…
A: The graph of number of drivers against speed is given.
Q: Among fatal plane crashes that occurred during the past 55 years, 553 were due to pilot error, 79…
A: The number of values corresponding to a class or observation is defined as the frequency of that…
Q: a) Define the type of the data b) Create the frequency, relative frequency table, and a histogram…
A: NOTE: Since there are multiple subparts we have solved the first three subparts for you. To get the…
Q: b) Marks obtained by 89 students in sociology are given below: 2+2+2=6 Marks No. of students 0-6…
A: The histogram is
Q: A frequency table of grades has five classes (A, B, C, D, F) with frequencies of 3, 11, 16, 7, and 1…
A: Formula Used: Relative frequency = Fn Where, F is the frequency and n is the sum of frequency.
Q: Ages Number of students 15-18 4 19-22 3 23-26 8 27-30 2 31-34 6 35-38 9 Based on the frequency…
A:
Q: II Flowers by Color and Type Red White Total Roses 47 34 81 Tulips 23 41 64 Total 70 75 145 Use the…
A:
Q: A data set is summarized in the frequency table below. The data set contains a total of 30 data…
A: Given that the data set contains 30 data values. That is, the sum of the frequencies must be 30.

Step by step
Solved in 2 steps with 2 images
