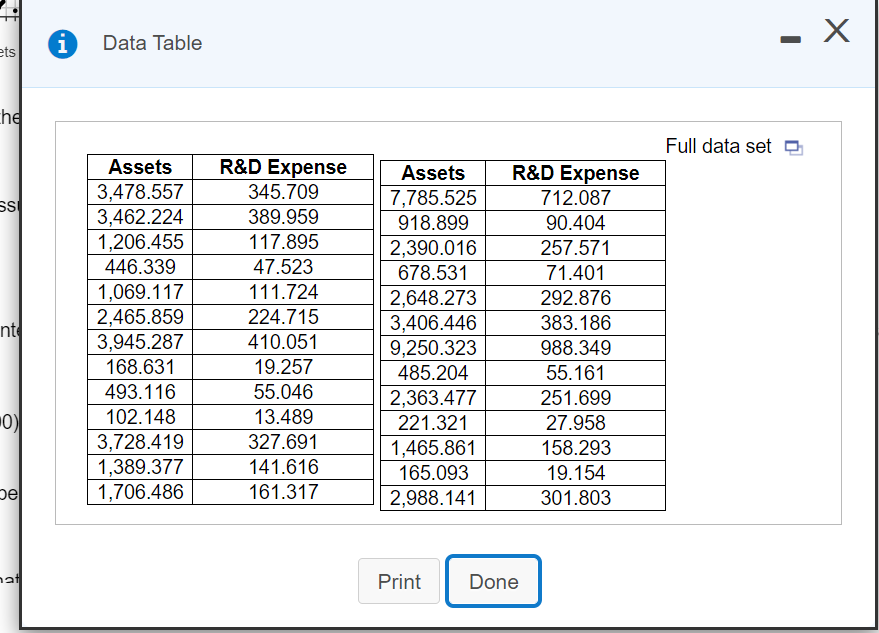
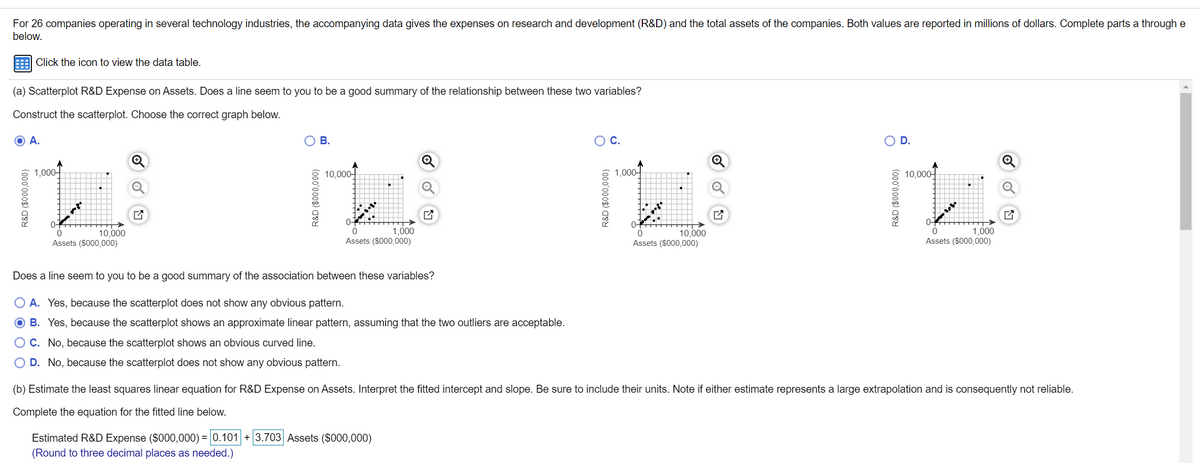
For 26 companies operating in several technology industries, the accompanying data gives the expenses on research and development (R&D) and the total assets of the companies. Both values are reported in millions of dollars. Complete parts a throu below. E Click the icon view the data table. (a) Scatterplot R&D Expense on Assets. Does a line seem to you to be a good summary of the relationship between these two variables? Construct the scatterplot. Choose the correct graph below. OA. OB. OC. OD. Q 1,000 8 10,000 1,000 8 10,000 10.000 Assets (S000,000) 1,000 Assets (S000,000) 10,000 Assets (S000,000) 1,00 Assets (S000,000) Does a line seem to you to be a good summary of the association between these variables? O A. Yes, because the scatterplot does not show any obvious pattern. O B. Yes, because the scatterplot shows an approximate linear pattern, assuming that the two outliers are acceptable. OC. No, because the scatterplot shows an obvious curved line. OD. No, because the scatterplot does not show any obvious pattern. (b) Estimate the least squares linear equation for R&D Expense on Assets. Interpret the fitted intercept and slope. Be sure to include their units. Note if either estimate represents a large extrapolation and is consequently not reliable. Complete the equation for the fitted line below. Estimated R&D Expense ($000,000) = 0.101 + 3.703 Assets ($000,000) (Round to three decimal planes as needed )


Correlation
Correlation defines a relationship between two independent variables. It tells the degree to which variables move in relation to each other. When two sets of data are related to each other, there is a correlation between them.
Linear Correlation
A correlation is used to determine the relationships between numerical and categorical variables. In other words, it is an indicator of how things are connected to one another. The correlation analysis is the study of how variables are related.
Regression Analysis
Regression analysis is a statistical method in which it estimates the relationship between a dependent variable and one or more independent variable. In simple terms dependent variable is called as outcome variable and independent variable is called as predictors. Regression analysis is one of the methods to find the trends in data. The independent variable used in Regression analysis is named Predictor variable. It offers data of an associated dependent variable regarding a particular outcome.


Trending now
This is a popular solution!

Step by step
Solved in 2 steps with 2 images


