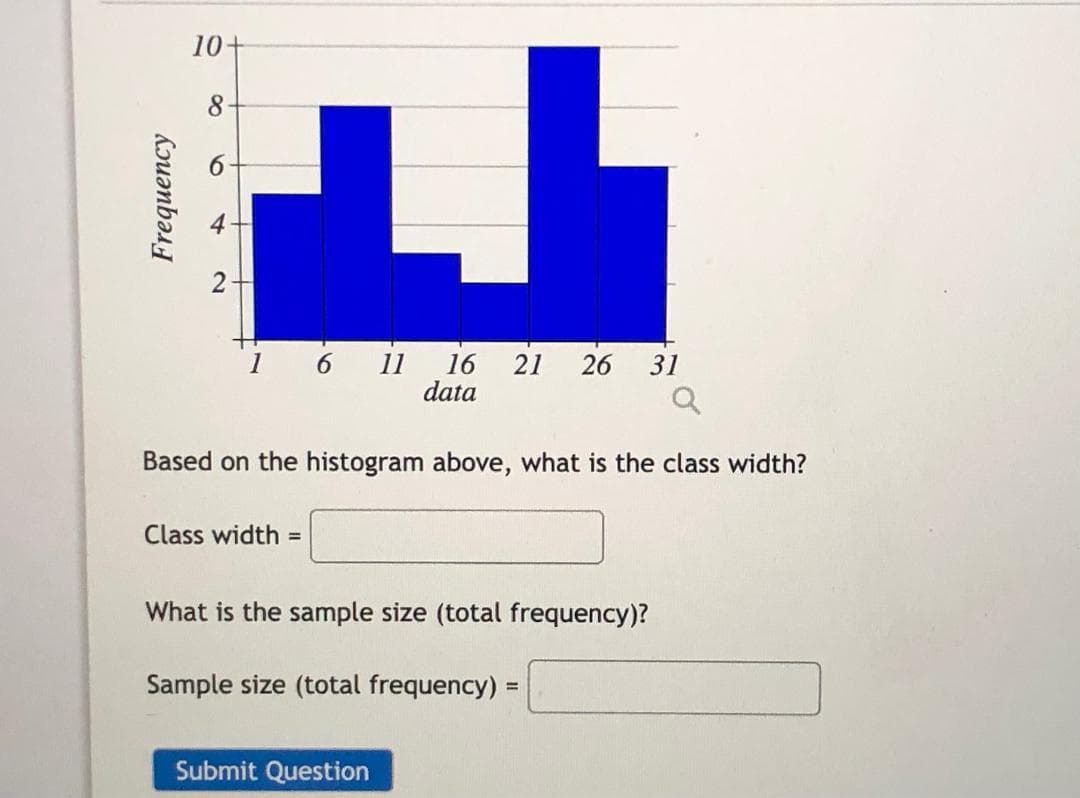
10 8 4 1 11 16 21 26 31 data Based on the histogram above, what is the class width? Class width = What is the sample size (total frequency)? Sample size (total frequency) Frequency


Q: 8- 7 13 19 25 31 37 data Based on the histogram above, what is the frequency of the bin containing…
A: Solution : Histogram shows numerical data by grouping data into bins. Bins are also called classes…
Q: Here is a set of sample data 11 12 22 28 29 40 50 32 59 62 67 75 93 95 98 Identify the 5 number…
A: The minimum value is, 11 The maximum value is, 98 The first quartile is, Therefore, the first…
Q: 10 11 12 13 15 15 16 17 18 18 What is the mean median and mode of this data in descriptive stat
A: Consider, X = 10, 11, 12, 13, 15, 15, 16, 17, 18, 18 The mean for the provided data set can be…
Q: The following set of data is from a sample of n= 6. 8 7 2 8 6 12 0 a. Compute the mean, median, and…
A: The variance can be calculated as follows: Step 1: Put the data onto the excel spreadsheet Step 2:…
Q: * :Determine the Variance for the data in the table below Classes Frequency 4.3-4.39 2 4.4 - 4.49…
A:
Q: 9) Consider the Stem and Leaf Diagram: 4 05 5 05 6 05 7 0000555 8 0005 9 0555 10 0 a) Construct a…
A: Hey there.! hope you're doing well. As per the guidelines we are supposed to answer the first three…
Q: 8+ 1 4. 7. 10 13 16 19 data Based on the histogram above, what is the class width? Class width =…
A: Determine the class width. The class width is obtained below as follows: From the given…
Q: Data was collected for fish from the North Atlantic. The length of the fish (in mm) is summarized in…
A: The class width of a frequency distribution is given by : class width = upper class limit -…
Q: • what are different between Univariate and Bivariate Data ? • Give the relative frequencies and…
A: Difference between univariate and bivariate data Find relative frequencies and percentages for…
Q: Heights of adults: Researchers studying anthropometry collected body girth measurements and…
A: Point estimate for average height or mean is 171.1 cm
Q: How much should a healthy Shetland pony weigh? Let x be the age of the pony (in months), and let y…
A: Procedure to draw scatterplot using Excel: Enter the data in an Excel sheet. Select the data and…
Q: what kind of samples are being described? Sample 1: Resting heart rates of 40 individuals before…
A: Given: Sample 1: Resting heart rates of 40 individuals before smoking. Sample 2: Resting heart rates…
Q: 10 8 2 1 13 data 17 21 25 Based on the histogram above, what is the class width? Class width = What…
A: We have given that the histogram in which frequency on y-axis and data on x-axis.
Q: 10+ 8. 2. 10 13 16 19 data Based on the histogram above, what is the class width? Class width = What…
A: Note that,here the class intervals are 1-4,4-7,7-10,10-13,13-16,16-19.We know that the class width…
Q: Exhibit 3-1 A researcher has collected the following sample data. 12 6. 6. 12 4 Refer to Exhibit…
A: According to the given information, we have A researcher has collected the sample data.Data: 5, 12,…
Q: 8. 6 1 16 21 data 26 31 Based on the histogram above, what is the frequency of the class containing…
A:
Q: 8 6 Frequency A N 16 21 26 31 data Based on the histogram above, what is the class width? 1 6 Class…
A:
Q: 10+ 8. 4- 2 1 6 11 16 data 21 26 31 Based on the histogram above, what is the class width? Class…
A: Determine the class width. The class width is obtained below as follows: From the given…
Q: Given the data below, test the hypothesis that the means of the three populations are equal. Let a =…
A: In this context, the aim is to test whether the mean of the three populations are equal. It is known…
Q: A. Data record for t-shirt owners. 4 8. 6. 10 11 15 16 18 19 12 13 14 18 17 Determine the following:…
A: Since you have posted a question with multiple sub-parts, we will solve first three sub-parts for…
Q: Calculate the coefficient of variation for the following sample data: 10 8 11 7 9 mean= 9
A:
Q: The owner of a manufacturing plant employs eighty people. As part of their personnel file, she asked…
A:
Q: 8 21 5 9 13 17 21 data 25 Based on the histogram above, what is the class width? Class width - What…
A:
Q: The sample data are summarized as follows: Muscat Dhofar n,=260 n=150 Mean cost =170 RO Mean cost Y:…
A: Since you have posted a question with multiple sub-parts, we will solve first three subparts for…
Q: For the data below construct the frequency distribution table with 5 classes and after that find: 1)…
A: Given data is appropriate for measures of central tendency to find the central value for the given…
Q: 38 36 36 34 34 28 28 17 17 16 16 13 13 9 9 8.6 8.6 8.1…
A: See the given sample data set provided in the question, the maximum value is 38 and minimum value is…
Q: 19. The score of students in a Math test is given in the table below. Class Interval 10 - 20 20 -30…
A: It is given that,
Q: 10+ 8 6. 1 3 5 7 data 9 11 13 Based on the histogram above, what is the class (bin) width? Class…
A: In the histogram, each block is called a class. The width of each block is called the class width.…
Q: 10+ 8 1 4 7 10 13 16 19 data Based on the histogram above, what is the class width? Class width =…
A: Solution:- From above Histogram , it is clear that class width = 4-1= 3
Q: Find Mean, Median, Mode, sample variance and range for following set of data: 0.23 0.36 0.56 0.89…
A: The mean can be calculated as: The data can be arranged in ascending order as: 0.23, 0.36, 0.56,…
Q: A manager wants to study the employees' absence behaviour in his company. He wishes to find the…
A: i) Here all the employees in the given company is a population. Obtained data from all employees is…
Q: #7. For the sample data 14.8 12.7 18.0 14.5 12.3 10.5 9.1 8.3 (a) Compute the sample mean x, sample…
A: The number of observation n is 8.
Q: The number of incidents in which police were needed for a sample of 11 schools in one county is: 18…
A: Use EXCEL Procedure to obtain the value of first quartile. Follow the instruction to obtain the…
Q: Here is a set of sample data 8 11 23 24 29 31 53 55 65 68 80 Identify the 5 number summary (min, Q1,…
A: Solution: The observation in increasing order is 8, 11, 23, 24, 29, 31, 53, 55, 65, 68, 80. n = 11…
Q: Identify the sample size from the histogram: 18 16 16 14 13 12 10 100 140 180 220 260 300 Weights 21…
A: We have given the histogram.
Q: Here is a histogram for a sample dataset: 25 20 240 270 300 330 What is the best choice for measures…
A: We want to tell the in histogram is best measure of center and dispersion for the data set
Q: Xbar/R Chart for C6-C9 UCL=24.94 24 Mean-23.93 23 LCL-22.91 Subgroup UCL-3.176 R-1.302 LCL 0 Sample…
A: here we see that out of 15 points 2 points are out of control so they remove that points and form a…
Q: 10 12 14 16 18 20 22 Education What was the sample size used? Females (thousands)
A: A scatter diagram is a graphic plot in which two sets of data are plotted against each other, along…
Q: 5.24: What is the required sample size? Hint: See L-11 pdf and lecture, page 11-12
A: Given information: α=0.05σ=80PType II≤0.025 Actual mean value is 550.
Q: 13. Given the list of the first quarter average of selected fifteen (15) Grade 11 Arts and Design…
A:
Q: 33) The owner of a manufacturing plant employs eighty people. As part of their personnel file, she…
A: Given data, 26, 32, 29, 16, 45, 19 First find the sample mean. Mean:
Q: 2. Thirty Asian Utility vehicles were tested for biodiesel fuel efficiency (in km/liter). The…
A: Class frequency(f) Mid- value (x) f.x cf 7.5-12.5 3 10 30 3 12.5-17.5 5 15 75 8 17.5-22.5 15…
Q: 11 15 23 29 19 22 21 20 15 25 17 The data above represents the amount of grams of carbohydrates in a…
A: Solution: From the given information, the amount of grams of carbohydrates in a serving of breakfast…
Q: The following set of data is given 2; 4; 5; 3; 6; 2; 3 Determine the value of coefficient of…
A: From the provided information, The mean and standard deviation of the data can be obtained as:
Q: Representativeness of a sample is principally determined by the ?
A: Definition: "Representative sampling" is a sort of statistical sampling that allows us to draw…
Q: Q9 For the following data: 16 32 8 28 12 20 18 Find the following: (a) Sample Variance (b) Sample…
A: The data given is as follows 16 32 8 28 12 20 18
Q: 11. Find population variance and SD for the following data. 11 - 16 17 - 22 12 23 -28 20 29 -34 18…
A: Given : X f Nov-16 5 17-22 12 23-28 20 29-34 18 35-40 5
Q: For the data below construct the frequency distribution table with 5 classes and after that find:…
A: For the given data , following frequency distribution table is constructed :…
Q: 10+ 4 1 9. 13 17 21 25 data Based on the histogram above, what is the class width? Class width = %3D…
A:

I need help


Trending now
This is a popular solution!

Step by step
Solved in 2 steps with 2 images


- Sample size requieraThe degrees of freedom is critical to computing the p-value for the chi-square goodness of fit. We will discuss the p-value in the next lab. The degrees of freedom for the Chi-Square goodness of fit is equal to (the number of non-zero rows in the table) - 1. The number of non-zero rows is the number of expected values that are non-zero. For example: Phenotype ... Expected ... Disease ... 234 ... Wild-type ... 6743 ... has two rows where the Expected value is non-zero. So the degrees of freedom is 2-1 = 1. Another example: Phenotype ... Expected ... Disease ... 2374 ... Wild-type ... 0 ... has one row where the Expected value is non-zero. So the degrees of freedom is 1-1 = 0. With 0 degrees of freedom, the chi-square test cannot be calculated. A third example (sex-linked): Phenotype ... Expected ... Disease-Male ... 2374 ... Disease-Female ... 9456 Wild-type-Male ... 1001 ... Wild-type-Female ... 235 ... has four rows where the Expected values are…R7 An experiment is to be carried out with three different drugs for treating migraine. 16 patients of similar age, health condition and migraine problems are identified. Give the layout (before randomization) of a designed experiment to carry out this experiment. Write down the model for analysing the data and show the ANOVA table format with the expressions for the Sums of squares.
- Homer Simpson is interested in studying the ratio of the various colors of sprinkles on Lard Lad donuts. To conduct his study, Homer purchases three of each variety of donut they make and counts the sprinkles on them. What method did Homer use to select his sample? 1. Stratified 2. Simple Random Sample 3. SystematicCharacter recognition An automatic character recogni-tion device can successfully read about 85% of hand-written credit card applications. To estimate what might happen when this device reads a stack of applications, thecompany did a simulation using samples of size 20, 50,75, and 100. For each sample size, they simulated 1000samples with success rate p = 0.85 and constructed thehistogram of the 1000 sample proportions, shown here.Explain how these four histograms demonstrate what the Central Limit Theorem says about the sampling distribu-tion model for sample proportions. Be sure to talk about shape, center, and spread.Find the F-test and T-test (T-test calculated and T- table) of sample A and B using the data.
- Big Blossom Greenhouse was commissioned to develop an extra large rose for the Rose Bowl Parade. A random sample of blossoms from Hybrid A bushes yielded the following diameters (in inches) for mature peak blooms. 2 in, 3 in, 3 in, 8 in, 10 in, 10 inMagnetic surveying is one technique used by archaeologists to determine anomalies arising from variations in magnetic susceptibility. Unusual changes in magnetic susceptibility might (or might not) indicate an important archaeological discovery. Let x be a random variable that represents a magnetic susceptibility (MS) reading for a randomly chosen site at an archaeological research location. A random sample of 120 sites gave the readings shown in the table below.Chi-square test for k Independent Samples
- A chi square test for independence and homogeneity is appropriate if: Select one: a. the data is normally distributed b. the sample size is greater than 30 c. the expected frequency in each cell is 5 or greater d. the expected frequency in each cell is less than 5In a test of significance, if all else is held constant, what can be done to increase the power of a test? Decrease the sample size. Decrease the significance level. Decrease the sample size or decrease the significance level. Increase the sample size or increase the significance level.hw 10 Based on the histogram above, what is the class width?Class width = What is the sample size?Sample size =