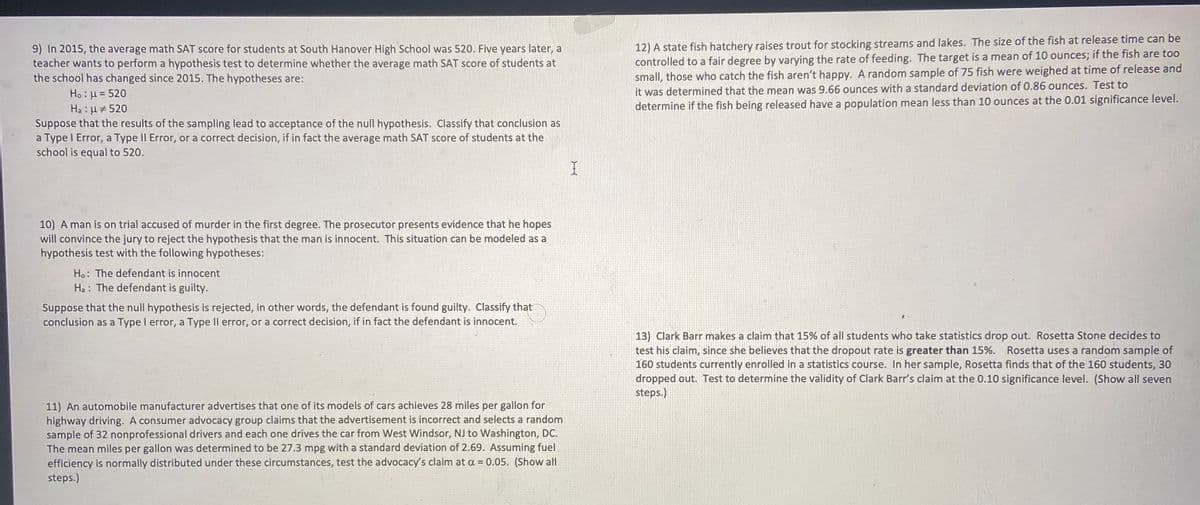
9) In 2015, the average math SAT score for students at South Hanover High School was 520. Five years later, a teacher wants to perform a hypothesis test to determine whether the average math SAT score of students at the school has changed since 2015. The hypotheses are: Ho:u= 520 H, : H 520 Suppose that the results of the sampling lead to acceptance of the null hypothesis. Classify that conclusion as a Type I Error, a Type Il Error, or a correct decision, if in fact the average math SAT score of students at the school is equal to 520.
9) In 2015, the average math SAT score for students at South Hanover High School was 520. Five years later, a teacher wants to perform a hypothesis test to determine whether the average math SAT score of students at the school has changed since 2015. The hypotheses are: Ho:u= 520 H, : H 520 Suppose that the results of the sampling lead to acceptance of the null hypothesis. Classify that conclusion as a Type I Error, a Type Il Error, or a correct decision, if in fact the average math SAT score of students at the school is equal to 520.

MATLAB: An Introduction with Applications
6th Edition
ISBN:9781119256830
Author:Amos Gilat
Publisher:Amos Gilat
Chapter1: Starting With Matlab
Section: Chapter Questions
Problem 1P

Related questions
Topic Video
Question
Transcribed Image Text:9) In 2015, the average math SAT score for students at South Hanover High School was 520. Five years later, a
teacher wants to perform a hypothesis test to determine whether the average math SAT score of students at
the school has changed since 2015. The hypotheses are:
12) A state fish hatchery raises trout for stocking streams and lakes. The size of the fish at release time can be
controlled to a fair degree by varying the rate of feeding. The target is a mean of 10 ounces; if the fish are too
small, those who catch the fish aren't happy. A random sample of 75 fish were weighed at time of release and
it was determined that the mean was 9.66 ounces with a standard deviation of 0.86 ounces. Test to
determine if the fish being released have a population mean less than 10 ounces at the 0.01 significance level.
Ho : H = 520
Ha : µ # 520
Suppose that the results of the sampling lead to acceptance of the null hypothesis. Classify that conclusion as
a Type I Error, a Type II Error, or a correct decision, if in fact the average math SAT score of students at the
school is equal to 520.
10) A man is on trial accused of murder in the first degree. The prosecutor presents evidence that he hopes
will convince the jury to reject the hypothesis that the man is innocent. This situation can be modeled as a
hypothesis test with the following hypotheses:
Ho: The defendant is innocent
Ha : The defendant is guilty.
Suppose that the null hypothesis is rejected, in other words, the defendant is found guilty. Classify that
conclusion as a Type I error, a Type Il error, or a correct decision, if in fact the defendant is innocent.
13) Clark Barr makes a claim that 15% of all students who take statistics drop out. Rosetta Stone decides to
test his claim, since she believes that the dropout rate is greater than 15%.
160 students currently enrolled in a statistics course. In her sample, Rosetta finds that of the 160 students, 30
dropped out. Test to determine the validity of Clark Barr's claim at the 0.10 significance level. (Show all seven
steps.)
Rosetta uses a random sample of
11) An automobile manufacturer advertises that one of its models of cars achieves 28 miles per gallon for
highway driving. A consumer advocacy group claims that the advertisement is incorrect and selects a random
sample of 32 nonprofessional drivers and each one drives the car from West Windsor, NJ to Washington, DC.
The mean miles per gallon was determined to be 27.3 mpg with a standard deviation of 2.69. Assuming fuel
efficiency is normally distributed under these circumstances, test the advocacy's claim at a = 0.05. (Show all
steps.)

Expert Solution
This question has been solved!
Explore an expertly crafted, step-by-step solution for a thorough understanding of key concepts.

This is a popular solution!

Trending now
This is a popular solution!

Step by step
Solved in 4 steps

Knowledge Booster


Learn more about
Need a deep-dive on the concept behind this application? Look no further. Learn more about this topic, statistics and related others by exploring similar questions and additional content below.Recommended textbooks for you
MATLAB: An Introduction with Applications
Statistics
ISBN:
9781119256830
Author:
Amos Gilat
Publisher:
John Wiley & Sons Inc

Probability and Statistics for Engineering and th…
Statistics
ISBN:
9781305251809
Author:
Jay L. Devore
Publisher:
Cengage Learning

Statistics for The Behavioral Sciences (MindTap C…
Statistics
ISBN:
9781305504912
Author:
Frederick J Gravetter, Larry B. Wallnau
Publisher:
Cengage Learning
MATLAB: An Introduction with Applications
Statistics
ISBN:
9781119256830
Author:
Amos Gilat
Publisher:
John Wiley & Sons Inc
Probability and Statistics for Engineering and th…
Statistics
ISBN:
9781305251809
Author:
Jay L. Devore
Publisher:
Cengage Learning
Statistics for The Behavioral Sciences (MindTap C…
Statistics
ISBN:
9781305504912
Author:
Frederick J Gravetter, Larry B. Wallnau
Publisher:
Cengage Learning

Elementary Statistics: Picturing the World (7th E…
Statistics
ISBN:
9780134683416
Author:
Ron Larson, Betsy Farber
Publisher:
PEARSON

The Basic Practice of Statistics
Statistics
ISBN:
9781319042578
Author:
David S. Moore, William I. Notz, Michael A. Fligner
Publisher:
W. H. Freeman

Introduction to the Practice of Statistics
Statistics
ISBN:
9781319013387
Author:
David S. Moore, George P. McCabe, Bruce A. Craig
Publisher:
W. H. Freeman