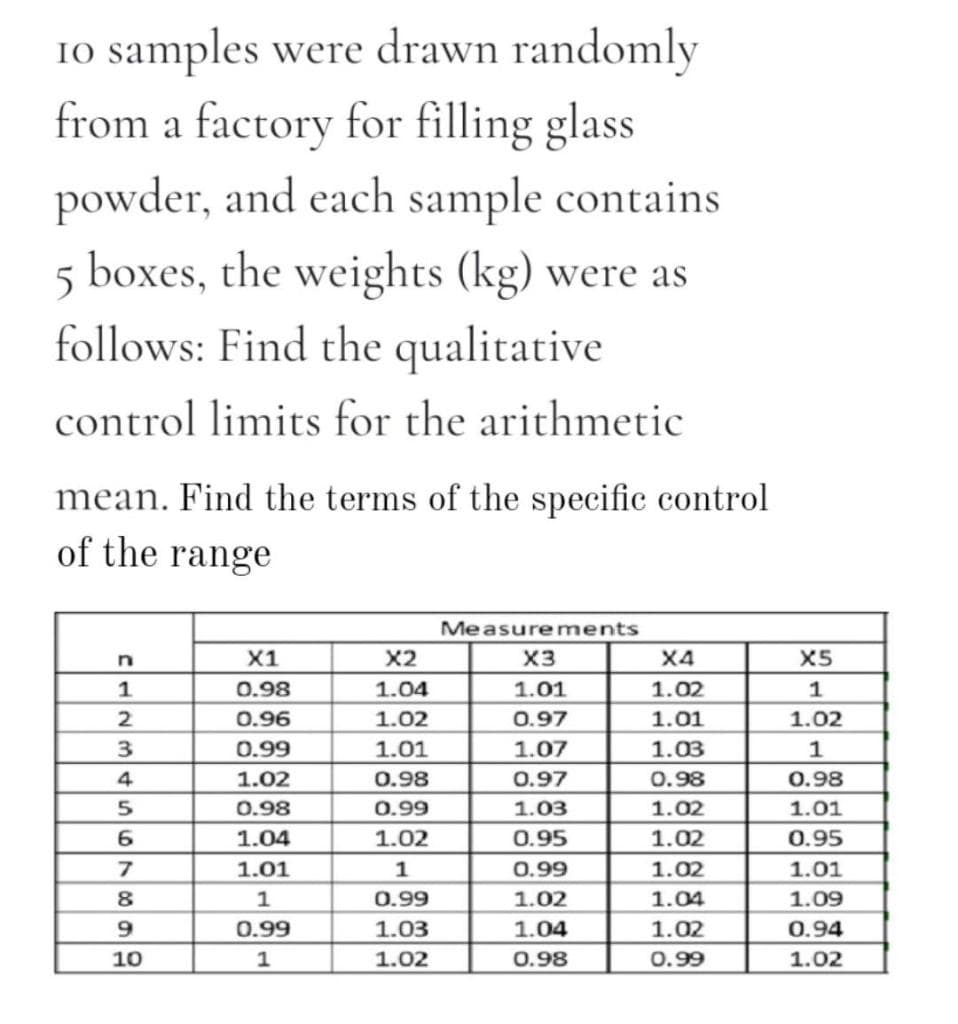
10 samples were drawn randomly from a factory for filling glass powder, and each sample contains 5 boxes, the weights (kg) were as follows: Find the qualitative control limits for the arithmetic mean. Find the terms of the specific control of the range Measurements X1 X2 X3 X4 X5 0.98 1.04 1.01 1.02 1 2 0.96 1.02 0.97 1.01 1.02 3 0.99 1.01 1.07 1.03 1 4 1.02 0.98 0.97 0.98 0.98 0.98 0.99 1.03 1.02 1.01 1.04 1.02 0.95 1.02 0.95 1.01 1 0.99 1.02 1.01 8 1 0.99 1.02 1.04 1.09 0.99 1.03 1.04 1.02 0.94 10 1 1.02 0.98 0.99 1.02
Q: /For the below frequency distribution table calculate all the below reequipments. Class Frequency…
A: Since you have posted a question with multiple sub-parts, we will solve first three subparts for…
Q: The following data reflect the number of defects produced on an assembly line at an electronics…
A: Reviewing information, X : No. of defects produced on an assembly line…
Q: Suppose we want to know whether the mean of unemployment differs among the residents of two local…
A: Assume that the variance of unemployment in Community A is σ12 and the variance of unemployment in…
Q: The scores that golfers shot on 18 holes at a local course were tabulated. The results are shown in…
A:
Q: Q3 Find an estimate of the variance and standard deviation of the following data in Table 1 for the…
A: Given that Class Frequency 0 - 10 6 10 - 20 16 20 - 30 24 30 - 40 25 40 - 50 17…
Q: Following table shows the frequency distribution for the number of minutes per week spent watching…
A: “Since you have posted a question with multiple sub-parts, we will solve first three subparts for…
Q: When is the desired mean, m , used in establishing the center-line of a control chart instead of x ?
A: Normally during the methodology for drawing control charts, samples are drawn from a stable process…
Q: 1. For each day of last year, the number of vehicles passing through a certain intersection was…
A:
Q: last?dep=26418811 Suppose data made available through a health system tracker showed health…
A:
Q: Computer upgrades have a nominal time of 80 minutes. Samples of five observations each have been…
A: Given data: 1 2 3 4 5 6 79.2 80.5 79.6 78.9 80.5 79.7 78.8 78.7 79.6 79.4 79.6 80.6 80.0…
Q: In calculating the moments of a frequency distribution based on 100 observations, the following…
A:
Q: urketing study of 800 adults in the 18-34 age group reported the following information: pent less…
A: Given : Money spent Frequency 0 45 <$100 250 $100-$499.99 195 $500-$999.99 310 Total…
Q: The data to the right contain the state cigarette tax (in $) for all 20 regions of a country. 1.36…
A: Given that The state cigarette tax (in $) for all 20 regions of a country. 1.36 ,1.70 , 2.51 , 0.45…
Q: The last digit of the heights of 39 statistics students were obtained as part of an experiment…
A: Given that there are total 39 student & Maximum range of frequency is 5 & Total Digits are…
Q: A sample of 60 students at De Anza College was taken to estimate the average number of sodas…
A:
Q: The following are the test scores obtained by 40 employees in a Satisfactory Assessment of a certain…
A: Find mean, median and mode
Q: Compute price index for the following data by applying weighted average of price relatives method…
A:
Q: Compute the weighted mean for the following data
A: 19 12 228 17 30 510 14 28 392 13 10 130 18 10 180
Q: Suppose Electronics and Electrical Engineering students of Holy Angel University wants to examine…
A: State the hypotheses.
Q: Find the 20%20% trimmed mean of the following data. If necessary, round to one more decimal place…
A: The trimmed mean is calculated as, 20*20/100 = 4 data points are removed from each end and calculate…
Q: I. Construct the graph and compute for the value of skewness. Identify the type of skewness and its…
A:
Q: The following table summarizes the grade point averages (GPAs) of graduate students in a statistics…
A:
Q: Find the Z-score that describes the following proportions under the normal curve (within 0.01…
A: We have tl find z score that describes given event . We have to use z table for it.
Q: For the following set of data from two independent samples, conduct an independent samples t test…
A: The hypotheses are given below:
Q: In the following hypothetical scenarios, classify each of the specified numbers as a parameter or a…
A: a)There are 100 senators in the 114th Congress, and 54% of them are Republicans. The 54% here is a…
Q: The McClatchy News Service reported on a sample of prime-time television hours. The following table…
A: Solution :
Q: 36. Find the mean for the following frequency tables. a. Grade Frequency 49.5–59.5 2 59.5–69.5 3…
A: Since you have posted multiple questions, as per our guidelines we have provided answer for first…
Q: The following data provides the values of sample mean X and the range R for the samples of size 5…
A: Given that We have to find the control limits of X bar chart and R chart and determine whether…
Q: Calculate the coefficient of concurrent deviations for the following data
A: Let X denote the Supply and Y denote the Demand. We have to calculate the coefficient of concurrent…
Q: Three samples of 4 observations each have been taken, with actual measurements (in centimeters) show…
A: Given Information: Samples Sample 1 Sample 2 Sample 3 12 12 12 12.3 12.4 12 11 12 11 12…
Q: The distribution of a sample of 100 women of reproductive age group in a given community is given…
A:
Q: Q1/ For the below frequency distribution table calculate all the below requiments 1- Relative…
A: According to Bartleby guidelines I can only answer first three sub- questions given. Answer to…
Q: The NIH wants to compare the mean weight loss for five different diets. They measure the weight loss…
A: Obtain the value of the test statistic in the ANOVA table Use EXCEL Procedure to obtain the value…
Q: Suppose that the daily intake of an adult follows a uniform distribution from 40 to 65 micrograms.…
A: Solution
Q: The hourly rates of a sample of 70 contractual workers from different manufacturing company are…
A: Disclaimer, “Since you have posted a question with multiple sub-parts, we will solve first three…
Q: In the following hypothetical scenarios, classify each of the specified numbers as a parameter or a…
A:
Q: The mean length of sentence given in the three groups was as follows: Group 1: Attractive photo, M =…
A: The provided information is: Group 1: M=2.80Group 2: M=5.20Group 3: M=5.10 Consider that for…
Q: 2.3 Measures of the Center of the Data 36. Find the mean for the following frequency tables. a.…
A:
Q: . The ungrouped data below shows the different temperatures measured during n experiment. Construct…
A: The objective is to construct a frequency table for the ungrouped data and calculate its mean,…
Q: For the population of one town, the number of siblings, x, is a random variable whose relative…
A: Given Information: Population mean (u) = 1.3 Standard deviation (s) = 1.5 Sample size (n) = 32
Q: Let µ, represent the mean weight on Scale 1 and ug = 1-H2. Can you conclude that the the mean weight…
A: The appropriate Null and Alternative Hypotheses are given below: Null hypothesis: H0: µ1=µ2.…
Q: The daily functioning time of 65 machines in a factory is recorded in the following table. Daily…
A: Solution-: Let, x=Daily functioning time (hour) and f=Number of machines Our aim to obtain…
Q: 1. For each day of last year, the number of vehicles passing through a certain intersection was…
A:
Q: The following is a frequency distribution of an entrance examination. Class interval…
A: Solution 1) mean
Q: Calculate the correct t-statistics based on the information below. X1 = 200 X2 = 198 n1 = 17…
A: the formula for test statistic t=X1 - X2(S1)2n1+(S2)2n2 the given values are X1= 200 X2 = 198…
Q: The following frequency table shows the results for the number of times a week a person reads a…
A: Here we are given the data for the number of times a week a person reads a daily newspaper for a…
Q: The following data show the values of sample mean X and the range. R for the samples of size 5 each.…
A:
Q: The scores that golfers shot on 18 holes at a local course were tabulated. The results are shown in…
A: Given that data Class Frequency 68.5 - 73.5 5 73.5 - 78.5 6 78.5 - 83.5 10 83.5 - 88.5…
Q: 2. The following frequency distribution gives the age distribution of drivers who were at fault in…
A:
Step by step
Solved in 2 steps with 3 images
- In a bag of 335 chocolate candies, 34 of them are brown. The candy company claims that 13% of its plain chocolate candies are brown. For the following, assume that the claim of 13% is true, and assume that a sample consists of 335 chocolate candies. a. For the 335 chocolate candies, use the range rule of thumb to identify the limits separating numbers of brown chocolate candies that are significantly low and those that are significantly high. Values of (?)brown candies or fewer are significantly low.In a bag of 330 chocolate candies, 34 of them are brown. The candy company claims that 13% of its plain chocolate candies are brown. For the following, assume that the claim of 13% is true, and assume that a sample consists of 330 chocolate candies. a.For the 330 chocolate candies, use the range rule of thumb to identify the limits separating numbers of brown chocolate candies that are significantly low and those that are significantly high. Values of ? brown candies or fewer are significantly low.It is believed that the percent of female STEM majors at a particular college Is 29%. a)Say we select 15 random females from this college. Is this sample “large enough” to use the Central Limit Theorem for proportions? Use the conditions
- When using the central limit theorem for means with n = 57, it is not necessary to assume the distribution of the population data is normally distributed. True FalseJanice Sanders, CEO of Pine Crest Medical Clinic, isconcerned over the number of times patients must waitmore than 30 minutes beyond their scheduled appointments.She asked her assistant to take random samples of 70 patientsto see how many in each sample had to wait more than30 minutes. Each instance is considered a defect in the clinicprocess. The table below contains the data for 15 samples. a. Assuming Janice Sanders is willing to use three-sigmacontrol limits, construct a p-chart.b. Based on your p-chart and the data in the table, what canyou conclude about the waiting time of the patients?A research center claims that 26% of adults in a certain country would travel into space on a commercial flight if they could afford it. In a random sample of 1000 adults in that country, 29% say that they would travel into space on a commercial flight if they could afford it. At α=0.05, is there enough evidence to reject the research center's claim? Complete parts (a) through (d) below. (a) Identify the claim and state H0 and Ha. "Recall that the claim is the percentage of adults in the country would travel into space on a commercial flight if they could afford it. Let a success be an adult in the country who would travel into space on a commercial flight if they could afford it. Translate the claim made about the population parameter from a verbal statement to a mathematical statement." (b) Use technology to find the P-value. (c) Decide whether to reject or fail to reject the null hypothesis and (d) interpret the decision in the context of the original claim.
- Classify the following statements as to whether they belong to the area ofdescriptive statistics or inferential statistics___________________ 1. At most 5% of SLU students are smokers.___________________ 2. Assuming that less than 20% of the Kalinga coffee beans weredestroyed by a typhoon these past months, we should expect anincrease of no more than P30 for a kilogram of coffee by the endof the year. ___________________ 3. An employee generalized that the average monthly salary of a regular employee in a certain company is P12,000. ___________________ 4. A study found out that all customers who have received a giftcertificate from a store 75% went back to the store to shop.___________________ 5. The average grade in statistics of 50 students is 83.60.The ______ is sensitive to outliers, making this test not a good choice if there are any. A. N-way ANOVA B. ANOVA C. MANOVA D. Kruskal-Wallis H-testThe Central Limit Theorem is important in statistics because for any population, it says the sampling distribution of the sample mean is approximately normal, regardless of the sample size. for a large n, it says the sampling distribution of the sample mean is approximately normal, regardless of the shape of the population. for any sized sample, it says the sampling distribution of the sample mean is approximately normal. for a large n, it says the population is approximately normal.
- A research worker wants to determine the mean time it takes a mechanic to rotate the tires ofa car, and she wants to be able to assert with 95% confidence that the average of her sample isoff by at most 0.50 minutes. If she can presume from past experience that σ2 = 2:56 minutes,how large a sample will she have to take?Consider the case where the predetermined average number of bus arrivals at the Cubao Station is 6 per 15-minute period. Find the pro of at least 4 buses arriving in a 15-minute period.To investigate a possible relation between gender and handedness, a random sample of 320 adults was taken with the following results: Men Women Sample Size, n 168 152 Number of left-handed, x 24 9 a) Draw and state the rejection region in interval notation. b) State the test statistic and decision. c) Interpret your results.