For the following set of data from two independent samples, conduct an independent samples t test (by hand or using SPSS) to determine if the mean scores for each sample are significantly different. Sample 1: 5, 7, 4, 7, 2, 6, 7, 3, 4, 5 Sample 2: 3, 4, 3, 4, 3, 3, 3, 4, 5, 4, 3
For the following set of data from two independent samples, conduct an independent samples t test (by hand or using SPSS) to determine if the mean scores for each sample are significantly different. Sample 1: 5, 7, 4, 7, 2, 6, 7, 3, 4, 5 Sample 2: 3, 4, 3, 4, 3, 3, 3, 4, 5, 4, 3

Glencoe Algebra 1, Student Edition, 9780079039897, 0079039898, 2018
18th Edition
ISBN:9780079039897
Author:Carter
Publisher:Carter
Chapter10: Statistics
Section10.5: Comparing Sets Of Data
Problem 14PPS

Related questions
Topic Video
Question
For the following set of data from two independent samples, conduct an independent samples t test (by hand or using SPSS) to determine if the
Sample 1: 5, 7, 4, 7, 2, 6, 7, 3, 4, 5
Sample 2: 3, 4, 3, 4, 3, 3, 3, 4, 5, 4, 3
Expert Solution
Step 1
The hypotheses are given below:

Step 2
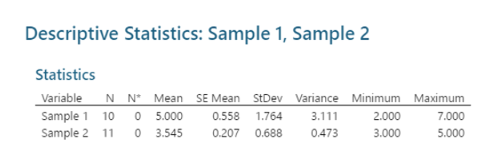
Step-by-step procedure to obtain the mean and standard deviation using MINITAB software:
- Choose Stat > Basic Statistics > Display Descriptive Statistics.
- In Variables enter the columns 8-10 year, 11 and 14 year.
- Choose option statistics, and select Mean and standard deviation.
- Click OK.
Output obtained using MINITAB software is given below:
Step 3
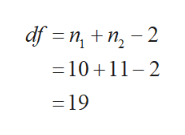
The degrees of freedom is,
Step 4
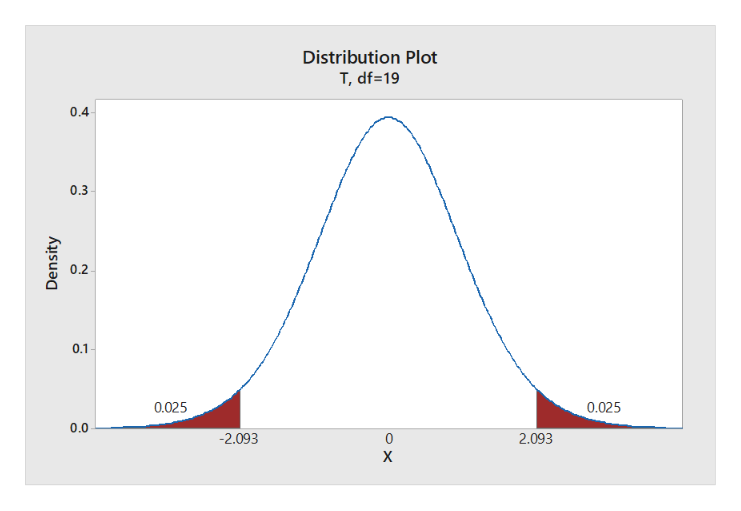
Step-by-step procedure to obtain the critical value using MINITAB software:
- Choose Graph > Probability Distribution Plot choose View Probability > OK.
- From Distribution, choose ‘t’ distribution.
- In Degrees of freedom, enter 19.
- Click the Shaded Area
- Choose Probability and both Tail for the region of the curve to shade.
- Enter the Probability as 0.05.
- Click OK.
Output obtained using MINITAB software is given below:

Trending now
This is a popular solution!

Step by step
Solved in 8 steps with 7 images

Knowledge Booster


Learn more about
Need a deep-dive on the concept behind this application? Look no further. Learn more about this topic, statistics and related others by exploring similar questions and additional content below.Recommended textbooks for you
Glencoe Algebra 1, Student Edition, 9780079039897…
Algebra
ISBN:
9780079039897
Author:
Carter
Publisher:
McGraw Hill
Glencoe Algebra 1, Student Edition, 9780079039897…
Algebra
ISBN:
9780079039897
Author:
Carter
Publisher:
McGraw Hill