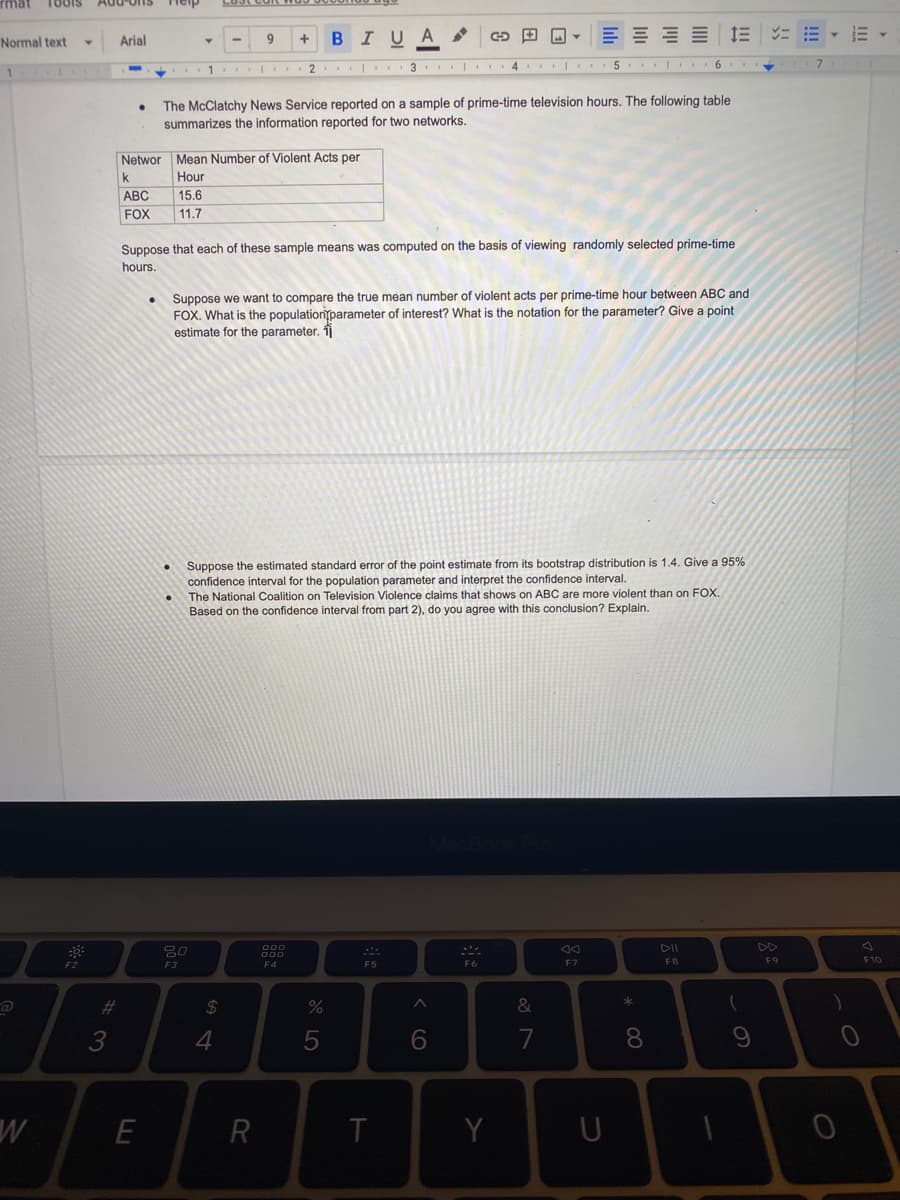
The McClatchy News Service reported on a sample of prime-time television hours. The following table summarizes the information reported for two networks. Networ Mean Number of Violent Acts per k Hour ABC 15.6 FOX 11.7 Suppose that each of these sample means was computed on the basis of viewing randomly selected prime-time hours. Suppose we want to compare the true mean number of violent acts per prime-time hour between ABC and FOX. What is the populationparameter of interest? What is the notation for the parameter? Give a point estimate for the parameter. Suppose the estimated standard error of the point estimate from its bootstrap distribution is 1.4. Give a 95% confidence interval for the population parameter and interpret the confidence interval. The National Coalition on Television Violence claims that shows on ABC are more violent than on FOX. Based on the confidence interval from part 2), do you agree with this conclusion? Explain.
The McClatchy News Service reported on a sample of prime-time television hours. The following table summarizes the information reported for two networks. Networ Mean Number of Violent Acts per k Hour ABC 15.6 FOX 11.7 Suppose that each of these sample means was computed on the basis of viewing randomly selected prime-time hours. Suppose we want to compare the true mean number of violent acts per prime-time hour between ABC and FOX. What is the populationparameter of interest? What is the notation for the parameter? Give a point estimate for the parameter. Suppose the estimated standard error of the point estimate from its bootstrap distribution is 1.4. Give a 95% confidence interval for the population parameter and interpret the confidence interval. The National Coalition on Television Violence claims that shows on ABC are more violent than on FOX. Based on the confidence interval from part 2), do you agree with this conclusion? Explain.

MATLAB: An Introduction with Applications
6th Edition
ISBN:9781119256830
Author:Amos Gilat
Publisher:Amos Gilat
Chapter1: Starting With Matlab
Section: Chapter Questions
Problem 1P

Related questions
Question
100%
I need explanation on how to do this question. I know the formulas. But after I am completely lost!
Transcribed Image Text:Add'ons
Heip
Arial
BIUA
Normal text
2
3 | 4 |.
5
6.
1
The McClatchy News Service reported on a sample of prime-time television hours. The following table
summarizes the information reported for two networks.
Networ Mean Number of Violent Acts per
k
Hour
АВС
15.6
FOX
11.7
Suppose that each of these sample means was computed on the basis of viewing randomly selected prime-time
hours.
Suppose we want to compare the true mean number of violent acts per prime-time hour between ABC and
FOX. What is the populationparameter of interest? What is the notation for the parameter? Give a point
estimate for the parameter. îj
Suppose the estimated standard error of the point estimate from its bootstrap distribution is 1.4. Give a 95%
confidence interval for the population parameter and interpret the confidence interval.
The National Coalition on Television Violence claims that shows on ABC are more violent than on FOX.
Based on the confidence interval from part 2), do you agree with this conclusion? Explain.
80
DD
F4
F5
F6
F7
F8
F9
F10
F2
F3
23
2$
&
4
7
8
R
Expert Solution
This question has been solved!
Explore an expertly crafted, step-by-step solution for a thorough understanding of key concepts.

This is a popular solution!

Trending now
This is a popular solution!

Step by step
Solved in 2 steps with 1 images

Recommended textbooks for you
MATLAB: An Introduction with Applications
Statistics
ISBN:
9781119256830
Author:
Amos Gilat
Publisher:
John Wiley & Sons Inc

Probability and Statistics for Engineering and th…
Statistics
ISBN:
9781305251809
Author:
Jay L. Devore
Publisher:
Cengage Learning

Statistics for The Behavioral Sciences (MindTap C…
Statistics
ISBN:
9781305504912
Author:
Frederick J Gravetter, Larry B. Wallnau
Publisher:
Cengage Learning
MATLAB: An Introduction with Applications
Statistics
ISBN:
9781119256830
Author:
Amos Gilat
Publisher:
John Wiley & Sons Inc
Probability and Statistics for Engineering and th…
Statistics
ISBN:
9781305251809
Author:
Jay L. Devore
Publisher:
Cengage Learning
Statistics for The Behavioral Sciences (MindTap C…
Statistics
ISBN:
9781305504912
Author:
Frederick J Gravetter, Larry B. Wallnau
Publisher:
Cengage Learning

Elementary Statistics: Picturing the World (7th E…
Statistics
ISBN:
9780134683416
Author:
Ron Larson, Betsy Farber
Publisher:
PEARSON

The Basic Practice of Statistics
Statistics
ISBN:
9781319042578
Author:
David S. Moore, William I. Notz, Michael A. Fligner
Publisher:
W. H. Freeman

Introduction to the Practice of Statistics
Statistics
ISBN:
9781319013387
Author:
David S. Moore, George P. McCabe, Bruce A. Craig
Publisher:
W. H. Freeman