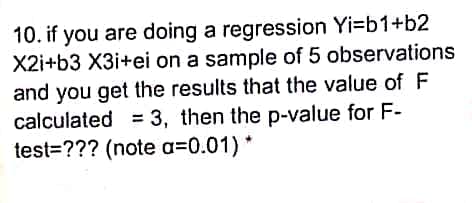
10. if you are doing a regressión X2i+b3 X3i+ei on a sample of 5 observations and you get the results that the value of F calculated = 3, then the p-value for F- -001)*


Q: 5. Find the equation of the normal line to the graph of f (x) =7-3x-x at x= 1
A: Given that f(x)=7-3x-x2We plug it in the given…
Q: Given that the regression equations of Y on X and of X on Y are respectively Y about the origin is…
A:
Q: According to the above information, we are able to conduct a t-test to determine the significance of…
A: Given Information: Dependent variable=YIndependent…
Q: Suppose that , and ©2 are unbiased estimators of the parameter 0 and that V (6,) = 15 and V(@2) = 4.…
A:
Q: 4. Suppose that ê, and Əz are unbiased estimators of the parameters 0. We know that V(0,) = 20 and…
A:
Q: A regression analysis with formula y 30 • 2x has a standard error of 1, and a t-statistic of 2.0.…
A:
Q: A physician wants to test if temperature has an effect on heart rate. In order to do this, she…
A: In this question, it has been given,Test Statistics = 5.627Level of significance = 0.05Rejection…
Q: In a population distribution, a score of X 5 28 cor- responds to z 21.00 and a score of X 34 cor-…
A: Given: The z-score corresponding to X = 28 is -1.00. The z- score corresponding to X = 34 is -0.50.…
Q: f(x) = 3 – x² – x³ – e-2x = 0 (even student ID) with a precision of 4 digits and the inital guess of…
A:
Q: 14. The variates x and y are normally correlated with coefficient r and u, v are defined by u =x cos…
A:
Q: If the coefficient of determination (R2) value is 0.99, it means the 99% of ____________ of the…
A: We have to fill blanks. If the coefficient of determination (R2) value is 0.99, it means the 99% of…
Q: 1) For what values of X should Ho be rejected so that the level of the test will be 0.01? What will…
A: Given Information: Given that, Null hypothesis to be tested is , In statistical terms,H0 : μ>12…
Q: For 50 randomly selected speed dates, attractiveness ratings by males of their female date partners…
A:
Q: 13. Find ML. J 3x + 11 K N 45 7, 10x - 12
A: According to guide and we should have been able to do only one question at a time #13
Q: If E(X) = 6 and E[(X)(X-1)] = 51, a) find the second moment b) find the variance of X Please…
A: Here we need to find the second moment and the variance.
Q: Question 7 - Using a suitable linearization to approximate √101 show that the approximate value is…
A: Given, 101 we have to approximate it by using linearization.
Q: 5. Find the equation of the normal line to the curve y=x-2x+6 at the point (0,6).
A:
Q: 1. Find the equation of the normal line to the curve at the point indicated. Express your answer in…
A: Since you have posted multiple questions i can do first question as per our company guidelines…
Q: 2. Show that for simple linear regression (SLR) we have that cov(B, B,) = - xoʻ/S
A:
Q: A researcher reports an F-ratio with df(between) = 3 and df(within) = 28. How many treatment…
A: Note: Hey there! Thank you for the question. As you have posted multiple questions, we have helped…
Q: Find ln(9.2) from ln(9.0) = 2.1972 and ln(9.5) = 2.2513 by linear interpolation and get the %error.
A: We need to find ln(9.2)
Q: Find solution of the problem in the form of the normal mode u * eo-xlc) and discuss the result a²u…
A: Given that : u=eiw(t-xc) Simplify it, we get : u=eiwt.e-iwxc. We know that : eiθ=cosθ+i.sinθ .…
Q: 1. Find the root of: f(x) = e^x - 4x^2. Newton Raphson Method %3! Initial estimate : 1 Stopping…
A: We are entitled to solve only one question at a time so we will answer only the first question.…
Q: Find extreme value(s) of z = 2x¡ + x,xX2 + 4x3 + x,x2 + x} + 2
A: Consider the provided question, According to you we need to solve only part (d). (d)
Q: 2 4 Find an equation of the normal line to the curve 3x¯y' – x°cos(ny) + 4x + 2 = 0 at the point…
A:
Q: 2. Determine the approximate value of y if x = 1.5 for the data set {(-1, 5), (0, 1), (1, 1), (2,…
A:
Q: 4. Suppose that Đ, and Əz are unbiased estimators of the parameters 0. We know that V(é,) = 20 and…
A:
Q: Suppose that a manufacturer is testing one of its machines to make sure that the machine is…
A: From the provided information, The hypotheses are as follow: H0: µ = 15 Ha: µ > 15 The p value =…
Q: 5.a Suppose that 70% of all faculty members at large public universities in the US use iClickers in…
A: Given Information: 70% of all faculty members at large public universities in the US use iClickers…
Q: 9. If the coefficient of correlation between two variables x and y is 0.5 and the acute angle…
A:
Q: Suppose you fit the first-order model y = Bo + B, x4 + B,x, + B3x3 + Baxa + B5X5 + e to n= 28 data…
A: The given value of R2 is 0.94, SSE is 0.33 and the value of n is 28.
Q: Find the equation of the normal line to the given function at the given value. 1. f(x) = 3x4 - 5x3…
A: 1) Given data: The given function is f(x)=3x4-5x3. The given value of x is x'=2. The slope of the…
Q: (ρ(1) =? 2.0.602 (3×3!/4) =? (Gammafunction) 1. 1337
A: As per bartleby guidelines we only give first question answers. Please repost for other parts.
Q: A sample of two observatiors x₁, x2 has been drawn from a normal population. It is required to test…
A:
Q: −x^2+x+6 has root(s) at x=
A: To find the roots of the given equation.
Q: Suppose you estimate the following results: hourly_wage=5.5 +0.50edu + 0.10exper+ 0.10(edu*exper)…
A: Given: The regression equation is as follows hourly_wage=5.5+0.5edu+0.10exper+0.10×edu*exper edu =16…
Q: A sample is selected from a population with μ = 50 and σ = 12. If the sample mean of M = 56 produces…
A: Given The population mean = 50 The standard deviation = 12 The sample mean M =…
Q: 3. Find an equation of each of the normal lines to the curve y = x-4x that is parallel to the line x…
A:
Q: Suppose that and are unbiased estimators of the parameter 0. We know that V 2 estimator is the best?…
A: Best estimator among a group of unbiased estimator is one with less variance.
Q: 2. Write the equation of the normal line to the function: y = 6v2x – 1 at the point (2.5, 12).…
A:
Q: D. Obtain method of moments estimators for a and b.
A:
Q: et X1, ..., Xn is a sample from the population X ~Poi (2), then s the unbiased estimation of a; s…
A:
Q: Suppose P(t) represents the population of a certain mosquito colony, where tt is measured in days.…
A:
Q: A sample of patients is tested to determine if they have any hospital borne infections. How large of…
A: The random variable X follows normal distribution. We have to find the sample size. This is z-test…
Q: EXAMPLE 4.4 Ans: 3 Given the following data: -1 3 y3Df(x} Approximate f(2) by using Newton's divided…
A: We approximate f(2) by using Newton's divided difference interpolation.
Q: Ivy is not sure whether a particular c the coin is not fair if she observes 4 4.24 and alternative…
A: Ans:
Q: The variation of Y around its mean can be decomposed into which two parts?
A: Note: Hey there! Thank you for the question. As it is not mentioned whether Y is the response…
Q: If e is the angle between the two regression lines. Show that sin 0 < 1 - r2 (r is the correlation…
A:

E2

Step by step
Solved in 2 steps


- Olympic Pole Vault The graph in Figure 7 indicates that in recent years the winning Olympic men’s pole vault height has fallen below the value predicted by the regression line in Example 2. This might have occurred because when the pole vault was a new event there was much room for improvement in vaulters’ performances, whereas now even the best training can produce only incremental advances. Let’s see whether concentrating on more recent results gives a better predictor of future records. (a) Use the data in Table 2 (page 176) to complete the table of winning pole vault heights shown in the margin. (Note that we are using x=0 to correspond to the year 1972, where this restricted data set begins.) (b) Find the regression line for the data in part ‚(a). (c) Plot the data and the regression line on the same axes. Does the regression line seem to provide a good model for the data? (d) What does the regression line predict as the winning pole vault height for the 2012 Olympics? Compare this predicted value to the actual 2012 winning height of 5.97 m, as described on page 177. Has this new regression line provided a better prediction than the line in Example 2?A linear regression model based on a random sample of 36 observations on the response variable and 4 predictors has a multiple coefficient of determination equal to 0.697. What is the value of the adjusted multiple coefficient of determination?17. When the heights (in inches) and shoe lengths (also in inches) were measured for a large random sample of individuals, it was found that r = 0.89, and a regression equation was constructed in order to further explore the relationship between shoe length and height, with height being the response variable. From this information, what can we conclude? 1. The regression equation relating shoe length to height must have a positive intercept. 2. Approximately 89% of the variability in height can be explained by the regression equation. 3. Because the value of r is less than 1, we should characterize this relationship as being weak. 4. The regression equation relating shoe length to height must have a slope equal to 0.89. 5. The correlation coefficient should have no units.
- 4. In multiple regression, why do we prefer our IVs to be uncorrelated with each other (i.e., we want to be 0)?Suppose the simple linear regression model, Yi = β0 + β1 xi + Ei, is used to explain the relationship between x and y. A random sample of n = 12 values for the explanatory variable (x) was selected and the corresponding values of the response variable (y) were observed. A summary of the statistics is presented in the photo attached. Let b1 denote the least squares estimator of the slope coefficient, β1. What is the value of b1?In estimating the regression in the previous problem (#2), you are concerned that the t-statistics may be inflated because of serial correlation. You compute the DW statistic at 0.724 for the regression. Compute the sample correlation between the regression residuals from one period and those from the previous period. Perform a statistical test at the level to see if there is serial correlation. If you are using the table in the textbook, assume that the critical values of the DW statistic for 214 observations are about 0.11 higher than the critical values for 100 observations.
- If you have a b of 0.56 in a regression equation, what does this mean? For every one-unit increase in x, you get an increase of 0.56 in y r = .31 On average, the variability of real scores around the regression line is 0.56 For every 1 standard deviation increase in x, you get an increase of 0.56 standard deviations in yHaving the variation data regression line r=0.931 and the calculated coefficient of determination of 0.867.. And explained variation of the data of 86.7%.. About the unexplained variation? [ ] % of the variation is unexplained and is due to other factors or to sampling error. (Round to one decimal place as needed.)A physician wants to test if temperature has an effect on heart rate. In order to do this, she compares the heart rates in beats per minute of several random volunteers after a period of time in a room with a temperature of 50∘F and after a period of time in a room with a temperature of 75∘F. Suppose that data were collected for a random sample of 11 volunteers, where each difference is calculated by subtracting the heart rate in beats per minute in the 50∘F room from the heart rate in beats per minute in the 75∘F room. Assume that the populations are normally distributed. The physician uses the alternative hypothesis Ha:μd≠0. Suppose the test statistic t is computed as t≈5.627, which has 10 degrees of freedom. What range contains the p-value?
- 17. When the heights (in inches) and shoe lengths (also in inches) were measured for a large random sample of individuals, it was found that r = 0.89, and a regression equation was constructed in order to further explore the relationship between shoe length and height, with height being the response variable. From this information, what can we conclude? 1. Approximately 89% of the variability in height can be explained by the regression equation. 2. The regression equation relating shoe length to height might have a negative intercept. 3. Because the value of r is less than 1, we should characterize this relationship as being weak. 4.The correlation coefficient should have the units of “inches.” 5. The regression equation relating shoe length to height must have a slope equal to 0.89.Suppose that the general fertility rate, g f rt , is following an AR(1) process shown in the image below A) if y1<1, what is the expression for the mean and variance of g f t rt showing any assumptions that were made . b) suppose that Var (€|gfrt-1)= as shown in the image below. explain why you may not obtain a best linear unbiased estimator of y0 and y1 by estimating (3) using OLS.In a certain jurisdiction, all students in Grade Three are required to take a standardized test to evaluate their math comprehension skills.The file contains these data resulting from a random sample of n=30 schools within this jurisdiction. From these data you wish to estimate the model Yi=β0+β1Xi+ei where Xi is the percentage of Grade Three students in School i who live below the poverty line and Yi is the average mathematics comprehension score for all Grade Three students in the same school, School i. The observed data for the X variable is labled perbelowpoverty and the observed data for the Y variable is labeled mathscore in the file.Import (either hand type or load the file) data into R Studio, then answer the following questions based on the data.(a) Create a scatterplot of the data. What can you say about the nature of the relationship between the percentage of Grade Three students living below the poverty line in a certain school and the school's average Grade Three…
