10. The mass spectrum of an alcohol C5H120 is given below (Fig. 4.12). 100 45 80- 60- 40- 20- 59 73 de 88 20 30 40 50 60 70 80 90 m/e Fia 4 13 % Relative Abundance
10. The mass spectrum of an alcohol C5H120 is given below (Fig. 4.12). 100 45 80- 60- 40- 20- 59 73 de 88 20 30 40 50 60 70 80 90 m/e Fia 4 13 % Relative Abundance

Macroscale and Microscale Organic Experiments
7th Edition
ISBN:9781305577190
Author:Kenneth L. Williamson, Katherine M. Masters
Publisher:Kenneth L. Williamson, Katherine M. Masters
Chapter19: Alkenes From Alcohols: Cyclohexene From Cyclohexanol
Section: Chapter Questions
Problem 4Q

Related questions
Question
( do 10 with explanation
Transcribed Image Text:(b) CH3-CH–CH2–Č–0–CH3 and CH3-CH2-CH,–C–OC2H5
Scanned with Oken Scanner
Mass Spectroscopy
CH3
193
Can
CH3
-CH3 and C6H5–CH2–CH–CH3.
on
of
he
(a) CgH;-C
CH3
1
CH3
3
4
a C¢H5-C-CH2-CH3 and C6H5–CH2 C–CH2
CH3
CH —CH—CHз and CH3- с сН,—СН —СН3
(d) CH3
CH3
8
7
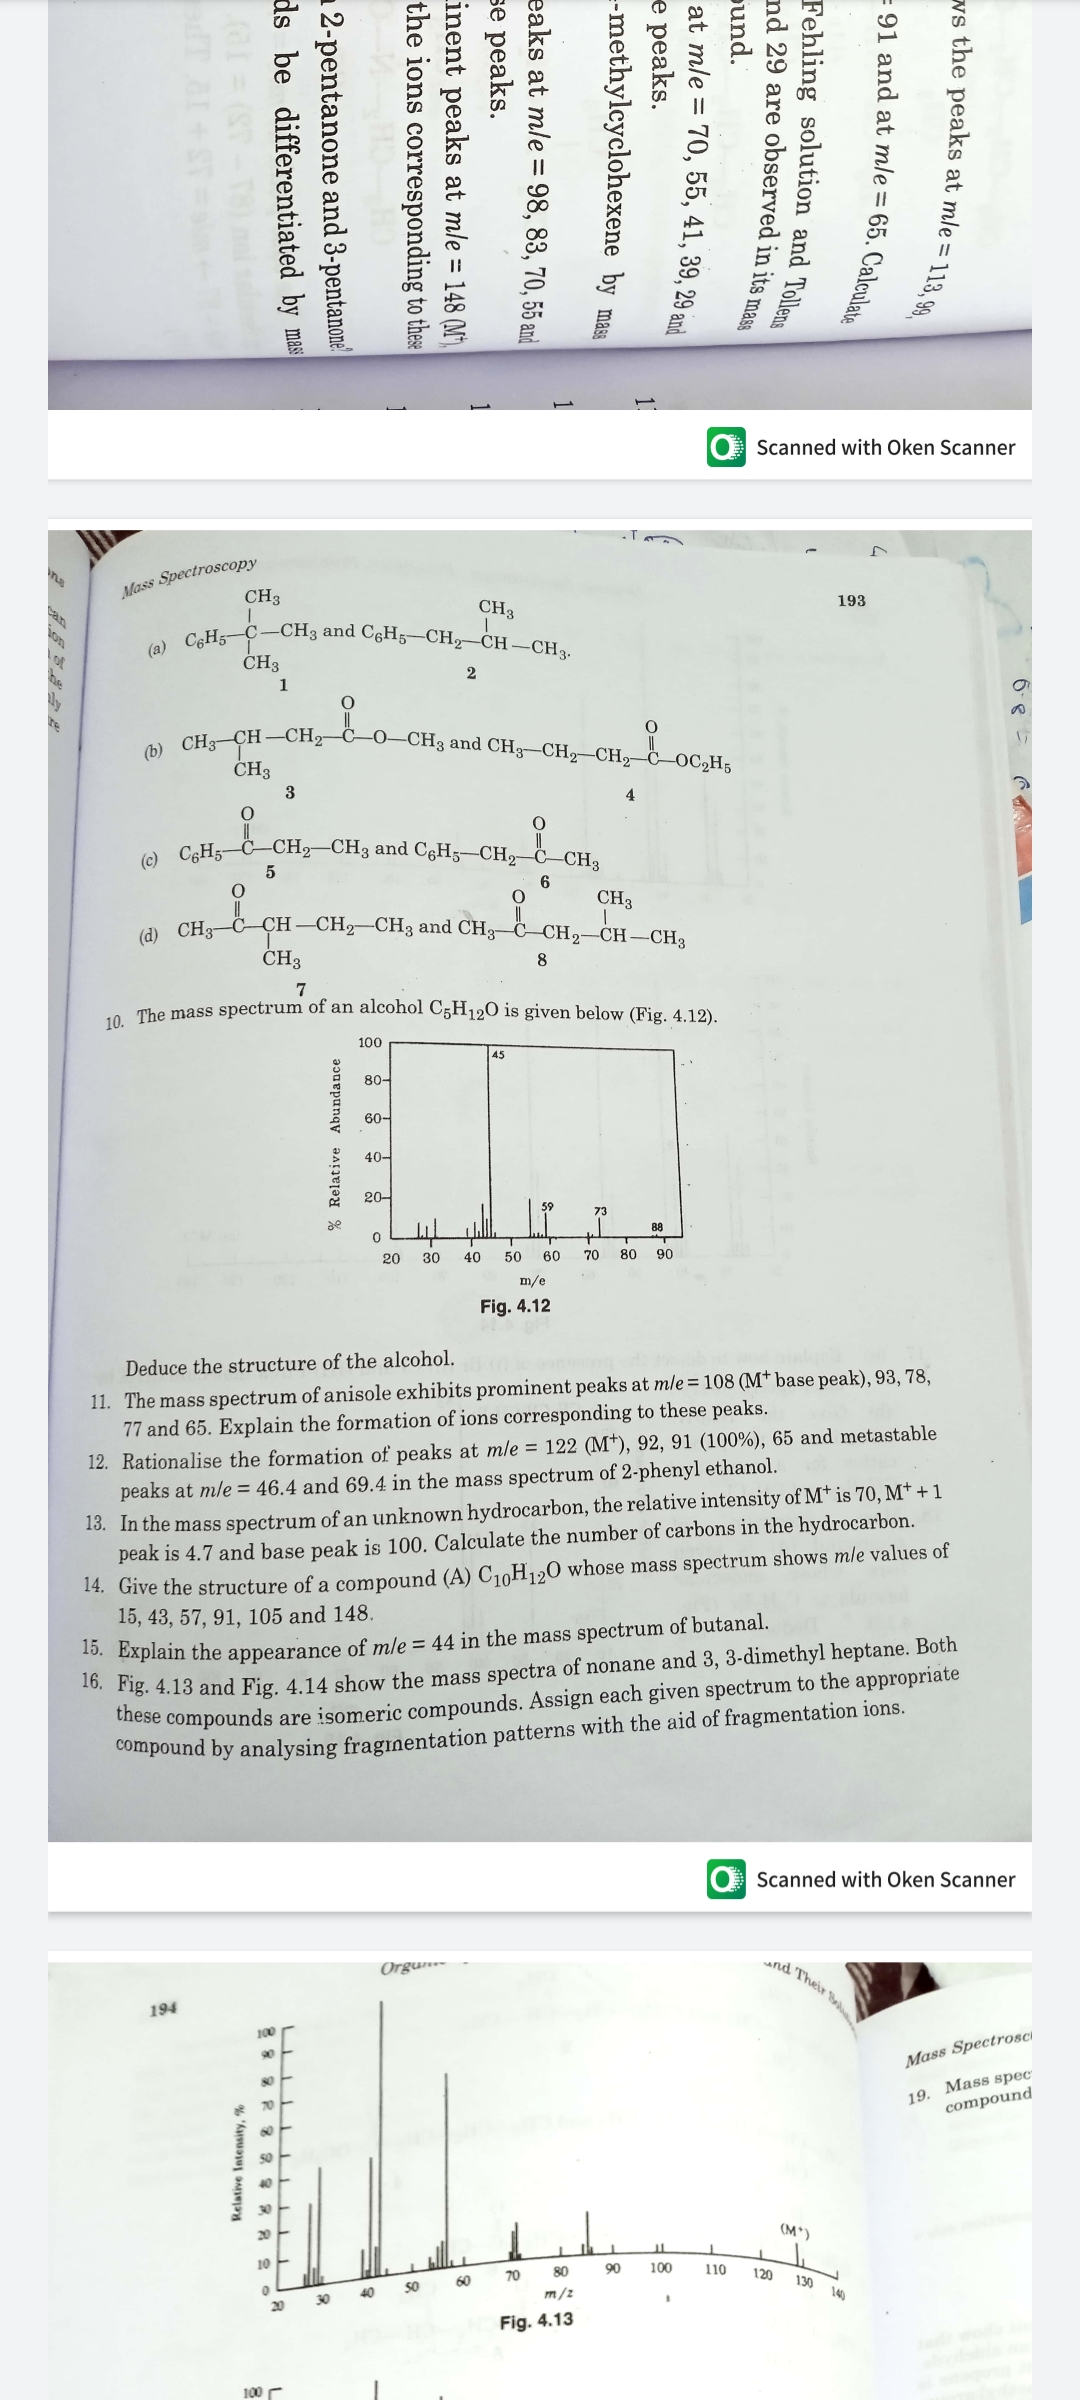
o The mass spectrum of an alcohol C5H120 is given below (Fig. 4.12).
100
45
80-
60-
40-
20-
59
73
de
88
20
30
40
50
60
70
80
90
m/e
Fig. 4.12
Deduce the structure of the alcohol.
11. The mass spectrum of anisole exhibits prominent peaks at mle=108 (M* base peak), 93, 78,
77 and 65. Explain the formation of ions corresponding to these peaks.
12. Rationalise the formation of peaks at mle = 122 (M*), 92, 91 (100%), 65 and metastable
peaks at mle = 46.4 and 69.4 in the mass spectrum of 2-phenyl ethanol.
13. In the mass spectrum of an unknown hydrocarbon, the relative intensity of M† is 70, M† + 1
peak is 4.7 and base peak is 100. Calculate the number of carbons in the hydrocarbon.
14. Give the structure of a compound (A) C10H120 whose mass spectrum shows mle values of
15, 43, 57, 91, 105 and 148.
Fig. 4.13 and Fig. 4.14 show the mass spectra of nonane and 3, 3-dimethyl heptane. Both
iese compounds are isomeric compounds. Assign each given spectrum to the appropriate
Compound by analysing fraginentation patterns with the aid of fragmentation ions.
0. Explain the appearance of mle = 44 in the mass spectrum of butanal.
Scanned with Oken Scanner
nd Their S
Orgun-
194
100
90
Mass SpectrosCi
19. Mass spec
compound
20
(M*)
10
80
90
100
110
120
60
70
130
40
50
m/z
140
30
20
Fig. 4.13
100 r
6-8
re the peaks at mle = 113,90
- 91 and at mle = 65. Calculat.
Fehling solution and Tolleme
nd 29 are observed in its mass
pund.
at mle = 70, 55, 41, 39, 29 and
е рeaks.
--methylcyclohexene by mas
eaks at mle = 98, 83, 70, 55 and
se peaks.
Linent peaks at mle = 148 (M'),
the ions corresponding to these
% Relative Abundance
2-pentanone and 3-pentanone
ds be differentiated by mas
Relative Intensity, %
Expert Solution
This question has been solved!
Explore an expertly crafted, step-by-step solution for a thorough understanding of key concepts.

Step by step
Solved in 2 steps with 2 images

Knowledge Booster


Learn more about
Need a deep-dive on the concept behind this application? Look no further. Learn more about this topic, chemistry and related others by exploring similar questions and additional content below.Recommended textbooks for you
Macroscale and Microscale Organic Experiments
Chemistry
ISBN:
9781305577190
Author:
Kenneth L. Williamson, Katherine M. Masters
Publisher:
Brooks Cole
Macroscale and Microscale Organic Experiments
Chemistry
ISBN:
9781305577190
Author:
Kenneth L. Williamson, Katherine M. Masters
Publisher:
Brooks Cole