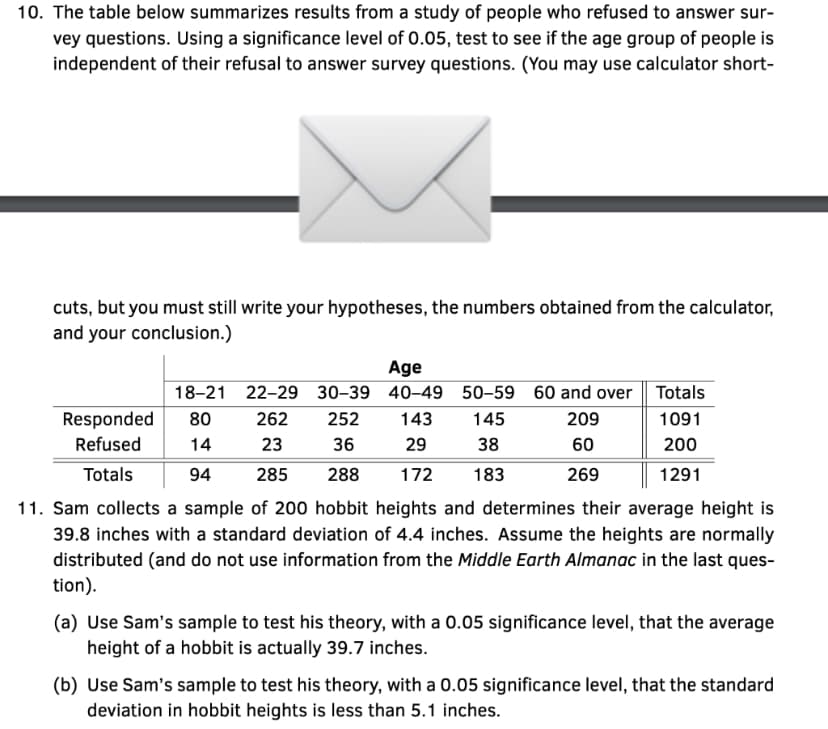
10. The table below summarizes results from a study of people who refused to answer sur- vey questions. Using a significance level of 0.05, test to see if the age group of people is independent of their refusal to answer survey questions. (You may use calculator short- cuts, but you must still write your hypotheses, the numbers obtained from the calculator, and your conclusion.)
10. The table below summarizes results from a study of people who refused to answer sur- vey questions. Using a significance level of 0.05, test to see if the age group of people is independent of their refusal to answer survey questions. (You may use calculator short- cuts, but you must still write your hypotheses, the numbers obtained from the calculator, and your conclusion.)

Glencoe Algebra 1, Student Edition, 9780079039897, 0079039898, 2018
18th Edition
ISBN:9780079039897
Author:Carter
Publisher:Carter
Chapter10: Statistics
Section: Chapter Questions
Problem 13PT

Related questions
Question
Transcribed Image Text:10. The table below summarizes results from a study of people who refused to answer sur-
vey questions. Using a significance level of 0.05, test to see if the age group of people is
independent of their refusal to answer survey questions. (You may use calculator short-
cuts, but you must still write your hypotheses, the numbers obtained from the calculator,
and your conclusion.)
Age
18-21
22-29 30-39 40-49 50-59 60 and over Totals
262 252 143 145
209
1091
36
29
38
60
200
23
285
288 172 183
269
1291
Responded 80
Refused 14
Totals 94
11. Sam collects a sample of 200 hobbit heights and determines their average height is
39.8 inches with a standard deviation of 4.4 inches. Assume the heights are normally
distributed (and do not use information from the Middle Earth Almanac in the last ques-
tion).
(a) Use Sam's sample to test his theory, with a 0.05 significance level, that the average
height of a hobbit is actually 39.7 inches.
(b) Use Sam's sample to test his theory, with a 0.05 significance level, that the standard
deviation in hobbit heights is less than 5.1 inches.
Expert Solution
This question has been solved!
Explore an expertly crafted, step-by-step solution for a thorough understanding of key concepts.

This is a popular solution!

Trending now
This is a popular solution!

Step by step
Solved in 2 steps with 2 images

Recommended textbooks for you
Glencoe Algebra 1, Student Edition, 9780079039897…
Algebra
ISBN:
9780079039897
Author:
Carter
Publisher:
McGraw Hill

College Algebra (MindTap Course List)
Algebra
ISBN:
9781305652231
Author:
R. David Gustafson, Jeff Hughes
Publisher:
Cengage Learning
Glencoe Algebra 1, Student Edition, 9780079039897…
Algebra
ISBN:
9780079039897
Author:
Carter
Publisher:
McGraw Hill
College Algebra (MindTap Course List)
Algebra
ISBN:
9781305652231
Author:
R. David Gustafson, Jeff Hughes
Publisher:
Cengage Learning