100 90 80 70 60 ATC 50 40 30 20 AVC МС О 10 + 0 0 5 10 15 20 30 35 40 45 50 QUANTITY (Thousands of shirts) or each price in the following table, use the graph to determine the number of shirts this firm would produce in order to maximize its profit. Assume hat when the price is exactly equal to the average variable cost, the firm is indifferent between producing zero shirts and the profit-maximizing uantity. Also, indicate whether the firm will produce, shut down, or be indifferent between the two in the short run. Lastly, determine whether it will nake a profit, suffer a loss, or break even at each price. Price Quantity (Dollars per shirt) (Shirts) Profit or Loss? Produce or Shut Down? Shut down 10 20,000 Loss Shut down 20 10,000 Loss Shut down 32 5,000 Loss Either 0 or 37,500 Shut down 40 Loss 25 COSTS (Dollars) On the following graph, use the orange points (square symbol) to plot points along the portion of the industry's short-run supply curve that corresponds to prices where there is positive output. (Note: You are given more points to plot than you need.) Then, place the black point (plus symbol) on the graph to indicate the short-run equilibrium price and quantity in this market. Note: Dashed drop lines will automatically extend to both axes. 100 O 90 Industry's Short-Run Supply Demand 80 70 Equilibrium 60 50 30 20 10 0 0 40 80 120 160 200 240 280 320 360 400 QUANTITY (Thousands of shirts) in the short run. In the long run, At the current short-run market price, firms will 40 PRICE (Dollars per shirt)
100 90 80 70 60 ATC 50 40 30 20 AVC МС О 10 + 0 0 5 10 15 20 30 35 40 45 50 QUANTITY (Thousands of shirts) or each price in the following table, use the graph to determine the number of shirts this firm would produce in order to maximize its profit. Assume hat when the price is exactly equal to the average variable cost, the firm is indifferent between producing zero shirts and the profit-maximizing uantity. Also, indicate whether the firm will produce, shut down, or be indifferent between the two in the short run. Lastly, determine whether it will nake a profit, suffer a loss, or break even at each price. Price Quantity (Dollars per shirt) (Shirts) Profit or Loss? Produce or Shut Down? Shut down 10 20,000 Loss Shut down 20 10,000 Loss Shut down 32 5,000 Loss Either 0 or 37,500 Shut down 40 Loss 25 COSTS (Dollars) On the following graph, use the orange points (square symbol) to plot points along the portion of the industry's short-run supply curve that corresponds to prices where there is positive output. (Note: You are given more points to plot than you need.) Then, place the black point (plus symbol) on the graph to indicate the short-run equilibrium price and quantity in this market. Note: Dashed drop lines will automatically extend to both axes. 100 O 90 Industry's Short-Run Supply Demand 80 70 Equilibrium 60 50 30 20 10 0 0 40 80 120 160 200 240 280 320 360 400 QUANTITY (Thousands of shirts) in the short run. In the long run, At the current short-run market price, firms will 40 PRICE (Dollars per shirt)

Principles of Economics 2e
2nd Edition
ISBN:9781947172364
Author:Steven A. Greenlaw; David Shapiro
Publisher:Steven A. Greenlaw; David Shapiro
Chapter7: Production, Costs, And Industry Structure
Section: Chapter Questions
Problem 4SCQ: Based on your answers to the WipeOut Ski Company in Exercise 7.3, now imagine a situation where the...

Related questions
Question
Transcribed Image Text:100
90
80
70
60
ATC
50
40
30
20
AVC
МС О
10
+
0
0
5
10
15
20
30
35
40
45
50
QUANTITY (Thousands of shirts)
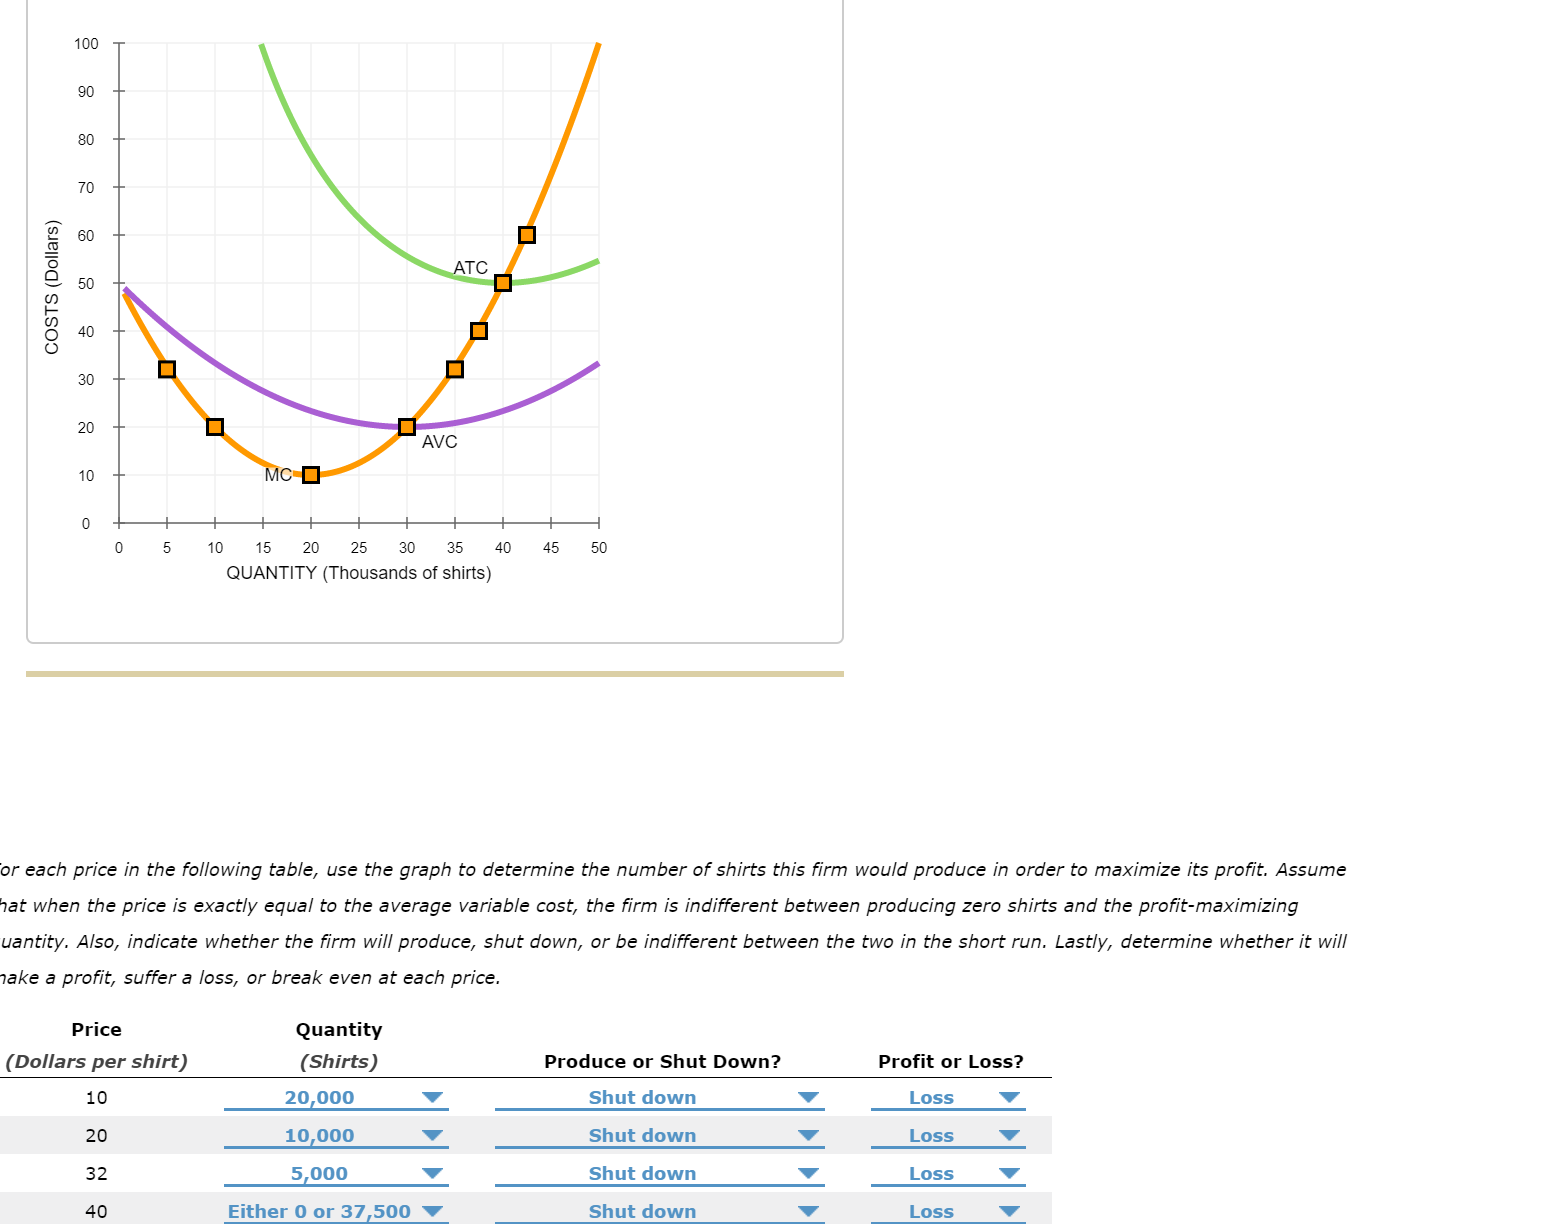
or each price in the following table, use the graph to determine the number of shirts this firm would produce in order to maximize its profit. Assume
hat when the price is exactly equal to the average variable cost, the firm is indifferent between producing zero shirts and the profit-maximizing
uantity. Also, indicate whether the firm will produce, shut down, or be indifferent between the two in the short run. Lastly, determine whether it will
nake a profit, suffer a loss, or break even at each price.
Price
Quantity
(Dollars per shirt)
(Shirts)
Profit or Loss?
Produce or Shut Down?
Shut down
10
20,000
Loss
Shut down
20
10,000
Loss
Shut down
32
5,000
Loss
Either 0 or 37,500
Shut down
40
Loss
25
COSTS (Dollars)
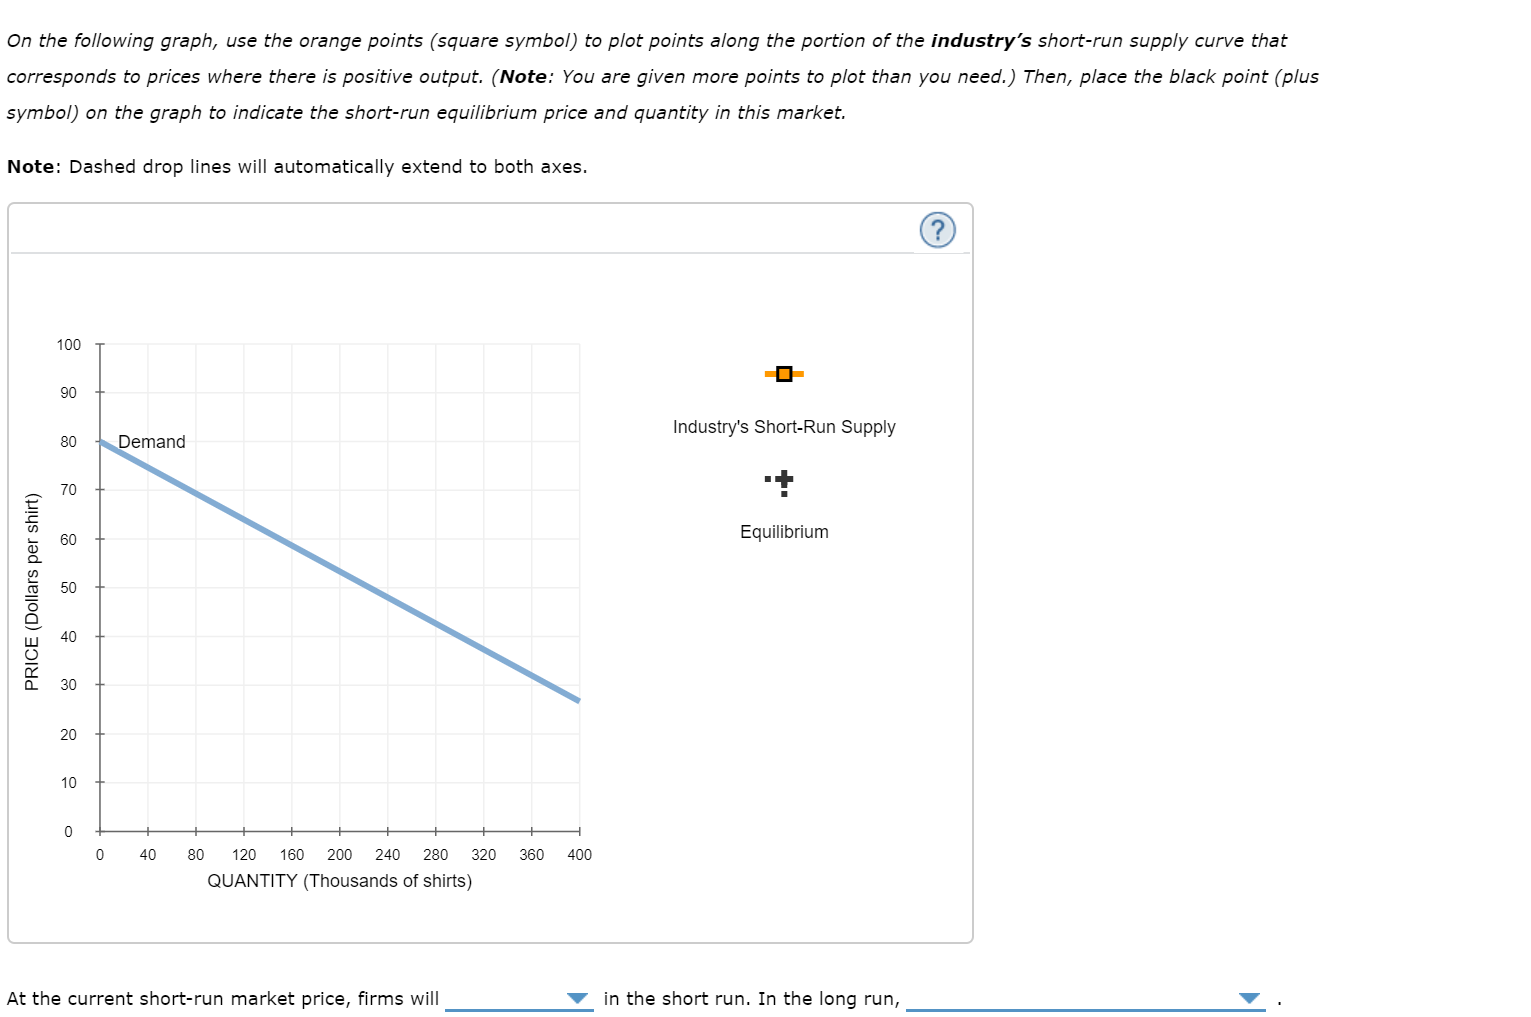
Transcribed Image Text:On the following graph, use the orange points (square symbol) to plot points along the portion of the industry's short-run supply curve that
corresponds to prices where there is positive output. (Note: You are given more points to plot than you need.) Then, place the black point (plus
symbol) on the graph to indicate the short-run equilibrium price and quantity in this market.
Note: Dashed drop lines will automatically extend to both axes.
100
O
90
Industry's Short-Run Supply
Demand
80
70
Equilibrium
60
50
30
20
10
0
0
40
80
120
160
200
240
280
320
360
400
QUANTITY (Thousands of shirts)
in the short run. In the long run,
At the current short-run market price, firms will
40
PRICE (Dollars per shirt)
Expert Solution
This question has been solved!
Explore an expertly crafted, step-by-step solution for a thorough understanding of key concepts.

This is a popular solution!

Trending now
This is a popular solution!

Step by step
Solved in 3 steps with 1 images

Recommended textbooks for you
Principles of Economics 2e
Economics
ISBN:
9781947172364
Author:
Steven A. Greenlaw; David Shapiro
Publisher:
OpenStax


Principles of Economics 2e
Economics
ISBN:
9781947172364
Author:
Steven A. Greenlaw; David Shapiro
Publisher:
OpenStax

Economics (MindTap Course List)
Economics
ISBN:
9781337617383
Author:
Roger A. Arnold
Publisher:
Cengage Learning

Essentials of Economics (MindTap Course List)
Economics
ISBN:
9781337091992
Author:
N. Gregory Mankiw
Publisher:
Cengage Learning

Managerial Economics: A Problem Solving Approach
Economics
ISBN:
9781337106665
Author:
Luke M. Froeb, Brian T. McCann, Michael R. Ward, Mike Shor
Publisher:
Cengage Learning