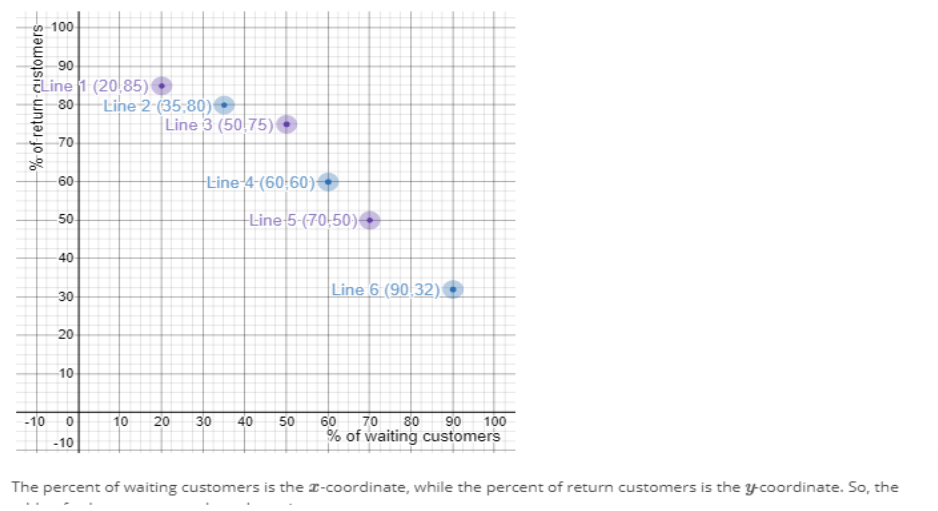
100 90 ELine 1 (20 85) -Line 2-(35:80) 80 Line 3 (50 75) 70 Line-4-(60-60): 60 Line 5-(70-50) 50 40 Line 6 (90 32). 30 20 10 10 90 100 60 % of waiting customers 80 40 30 -10 0 20 70 -10 The percent of waiting customers is the -coordinate, while the percent of return customers is the coordinate. So, the 50 TO % of return-austomers- The percent of waiting customers is the -coordinate, while the percent of return customers is the ycoordinate. So, the table of values corresponds to the points (20,85), (35,80), (50,75), (60, 60), (70, 50), (90,32) FEEDBACK Content attribution Understand the relationship between scatter plots and tables and determine patterns Question return customers if 80% of customers wait more than Using the linear relationship graphed above, estimate the percent of 10 minutes in line Provide your answer below


Using the linear relationship graphed below; estimate the percent of return customers if 80% of customers wait more than 10 minutes in line.
Provide your answer below: ___%
Question for answering above: A grocery store manager explored the relationship between the percent of customers that wait more than 10 minutes in line and the percent of return customers at the store. The manager collects information from 6 checkout lines, shown in the table below.
Use the graph below to plot the points and develop a linear relationship between the percent of waiting customers and the percent of return customers.
|
Line |
% of Waiting Customers |
% of Return Customers |
|
1 |
20 |
85 |
|
2 |
35 |
80 |
|
3 |
50 |
75 |
|
4 |
60 |
60 |
|
5 |
70 |
50 |
|
6 |
90 |
32 |


Trending now
This is a popular solution!

Step by step
Solved in 3 steps with 2 images


