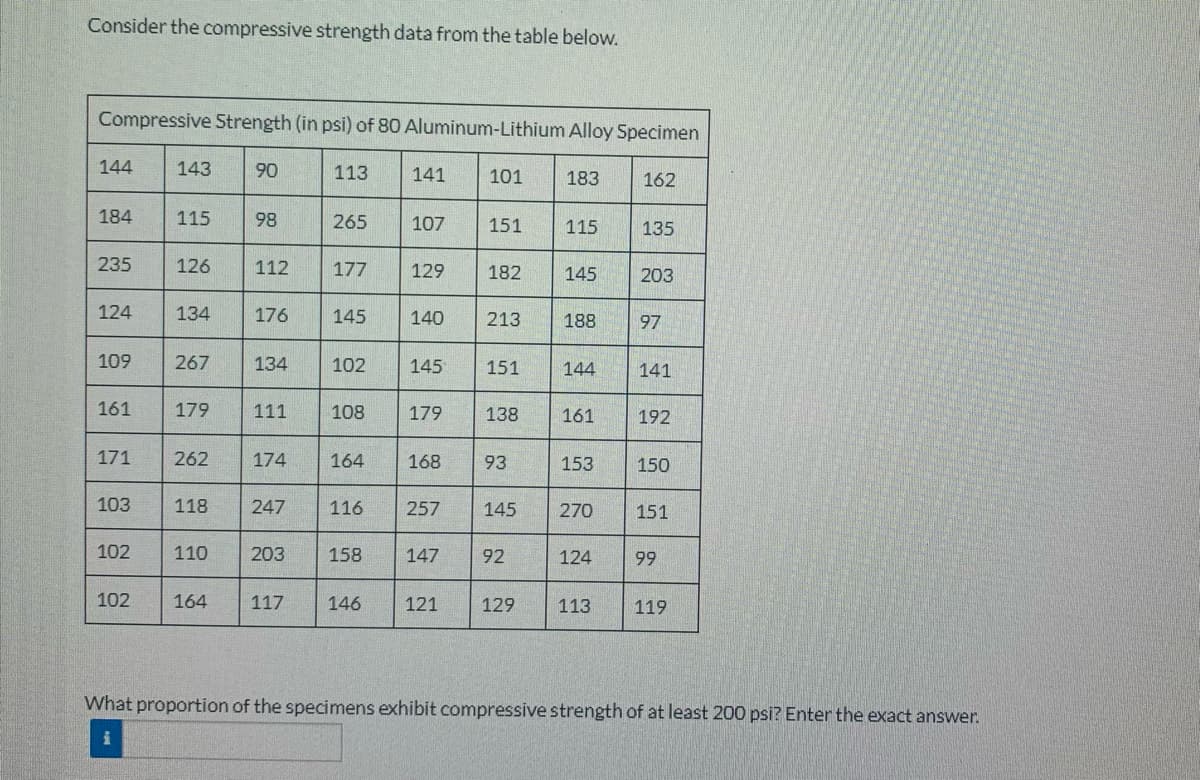
102 110 203 158 147 92 124 99 102 164 117 146 121 129 113 119 What proportion of the specimens exhibit compressive strength of at least 200 psi? Enter the exact answer.


Q: Test the claim that the proportion of people who own cats is significantly different than 80% at the…
A:
Q: Question 1 Add 5/24 + 11/36
A: Example:- Add a + a=2a
Q: After a while, they went to Haknyeon's Family Restaurant. On the shelf, there are 100 distinct…
A: It is given that Number of small cakes = 35 Number of blue cakes = 30 Number of small blue cakes =…
Q: Suppose X and Y have a bivariate normal distribution with x = (₁ 40, μy = 56, o² = 70 and p = .43.…
A: Solution
Q: random variables X₁ and X₂ have exponential distribution with ex ctively. Assume that X₁ and X₂ are…
A: *Answer:
Q: length, and die height. Observation number Pull strength (Y) Wire length (X1) Die Height (X2) 1 9.95…
A:
Q: A real estate company is trying to estimate the cost of rent in Houston. They randomly sample 10…
A:
Q: i) Mean x = kg ii) Ex² = iii) Standard deviation s = kg (to 3 significant figures)
A: here give stem leaf diagram use data from given diagram and calculate sample mean and standard…
Q: Suppose that the average number of Facebook friends users have is normally distributed with a mean…
A: Given that Mean=144 Standard deviation=58 Sample size=46 Note: According to bartleby experts…
Q: A test involving 340 men ages 20 to 24 found that their blood cholesterol levels had a mean of 188…
A:
Q: Activity 1.4. Determine the minimum sample size for eac 1. 95% confidence level, E = 4.8, 0-30 2.…
A: Given: At 95% confidence level, E=4.8, σ=30 At 96% confidence level, E=5, σ=45 At 99% confidence…
Q: Let X₁, X2, ..., X form a random sample from U (0-1,0 +). Find 1 minimal sufficient statistics.
A: X1,X2,...,Xn are random samples from Uθ-12,θ+12 PDF of Xi is given by, fXi(xi|θ) = 1θ+12-θ-12…
Q: Determine the margin of error and the confidence interval for each based the data given below. Show…
A: We have given that. 1) n = 58; x̄ = 75; σ = 10, 95% confidence interval. 2) n = 23; x̄ =…
Q: 3. Confidence Level =99%, x = 28, σ = 12, n = 60 4. To estimate the average salary of policemen, 64…
A: (3)
Q: The average number of minutes that students spend in doing daily homeworks are given below. Find…
A: Data given 80,140,95,110,75,120,90,200,130,65,125,145,170,140,100,95,115,150,145,30
Q: hirty samples of size 3 resulted in an overall mean of 16.13 minutes and average range control…
A: Here sample size n=3 X¯=16.13R=1.90
Q: What is the distribution of ¯xx¯? ¯xx¯ ~ N(,) For the group of 45, find the probability that the…
A: Since you have posted a question with multiple sub-parts, we will solve first three subparts for…
Q: The confidence interval for the independent samples t is estimating Group of answer choices the…
A: Solution-: The confidence interval for the independent samples t is estimating Group of answer…
Q: mple random sample of size n is drawn from a population that is normally distributed. The sample…
A: We have given that, Sample mean (x̄) = 112, standard deviation (s) = 10 Then, We will find the…
Q: Suppose that the weight of seedless watermelons is normally distributed with mean 6.7 kg. and…
A: As per our guidelines we can solve first three sub part of question and rest can be reposted.…
Q: According to a recent report, customers who shop at a certain online store spend, on average, $1,500…
A: Test is that whether mean amount spent was greater than $1500. It is given that P-value = 0.25
Q: co distinguish the difference between: Quantitative data. tio data.
A: According to guidelines we solve first question when given questions are different.
Q: A random sample of 29 students is surveyed from a dorm and 13 report there regularly being times…
A:
Q: 11. Let us assume that there are 280,000 voters in the NCR COMELEC district Barangay 1 clustered…
A:
Q: 3. The monthly number of cars sold by a car dealer from January to October for a particular year…
A:
Q: ailable in the Philippines. ons in the school.
A: According to guidelines we solve first question only when given questions are different.
Q: The histone protein H4 from cows and the H4 from p representing groups that diverged from one…
A:
Q: Seungcheol, Mingyu, Jeonghan and Joshua decided to play after their class. Jeonghan brought playing…
A:
Q: TextEdit File Edit Format View Window Help Hypothesis Test Assignment (1) D9E 4. The fuel economy…
A: (a) State the hypotheses.
Q: D. C. d. e. X= 7.8, s=5.1, n = 10 μ = 5.3, X= 5, s = 0.14, n = 8 μ = 9.1, X= 7.2, s = 1.8, n = 15…
A: According to guidelines we solve only first question when given questions are different.
Q: What is the appropriate (non-linear) objective function for this scenario (hint: distances are…
A:
Q: In the backward elimination process, what happened in the first step? How many steps are in the…
A: In backward elimination, it begins with a model containing all the independent variables of…
Q: A student was asked to find a 95% confidence interval for widget width using data from a random…
A: HERE use basic of confidence interval '
Q: Given this model: Y = B, + B₁ X₁ + B₂X2 + E where Y is the speed of innovation of the firm X1 is the…
A: Hello! As you have posted more than 3 sub parts, we are answering the first 3 sub-parts. In case…
Q: Data was collected for 219 randomly selected 10 minute intervals. For each ten-minute interval, the…
A:
Q: In a simulation of 30 mobile computer networks, the average speed, pause time, and number of…
A: Hi! Thank you for the question, As per the honor code, we are allowed to answer three sub-parts at a…
Q: Q4/4:The following data represent the number of damaged pieces of spare parts for the production of…
A:
Q: Do students perform better when they take an exam alone than when they take an exam in a classroom…
A: Note: As the drop down options are not visible in any answer, we will write the most appropriate…
Q: chipmunks in a particular chipmunk population are known to have a mean weight of 84 g and a standard…
A:
Q: years is given by Derive the expected value of Y? yet 100 0, f(y)=- 0<y<∞ elsewhere
A: Solution
Q: (a) Compute a 95% CI for the true average porosity of a certain seam if the average porosity for 15…
A: HERE AS PER GUIDELINES I HAVE CALCULATED 3 SUBPARTS PLZ REPOST FOR REMAINING PARTS Assure that the…
Q: At a magic shop, the salesperson shows you a coin that he says will land on heads more than 72% of…
A: Given that, at a magic shop, the salesperson shows you a coin that he says will land on heads more…
Q: (b) Based on your answer to part (a), choose the correct statement. The value of the test statistic…
A:
Q: The weights of a bag of cement admixture produced by a company is approximately normally distributed…
A:
Q: How Roman Bold 11 Z-Distribution 1. According to an NDP Group report, the mean number of meals…
A:
Q: For a normal distribution of individual scores with µ = 500 and σ = 100: a. What X values form…
A:
Q: Inexpensive bathroom scales are not consistently accurate. A manufacturer of bathroom 150-pound…
A: Given population mean = 150 population standard deviation =2
Q: Show that for all positive integers n and k, (~^)= (-1)^(" + k-1). k
A: The provided information is ( k-n) Then we prove this ( k-n)=(-n)*(-n-1)*(-n-2)*.....(-n-k+1)k!…
Q: The average number of miles (in thousands) that a car's tire will function before needing…
A: Given that Mean=74 Standard deviation=19 Sample size=45 Note: According to bartleby experts…
Q: Women with localized breast cancer are often given radiation treatment. A study tried to determine…
A: Given claim: New treatment would decrease the rate of recurrence. Null Hypothesis: H0:p2>=p1…


Trending now
This is a popular solution!

Step by step
Solved in 2 steps

- Spacers are manufactured to the mean dimension and tolerance shown in Figure 29-12. An inspector measures 10 spacers and records the following thicknesses: 0.372" 0.376" 0.379" 0.375" 0.370" 0.373" 0.377" 0.378" 0.371" 0.380" Which spacers are defective (above the maximum limit or below the minimum limit)? All dimensions are in inches.The vapor pressure of 1-chlorotetradecane at several temperatures are tabulated below. T (ºC) P∗ mm Hg 98.5 1 131.8 5 148.2 10 166.2 20 199.8 60 215.5 100 What error is there in using two-point linear interpolation to find the value of vapor pressure at 185ºC?The owner of a new car conducts a series of six gas mileage tests and obtains the following results, expressed in miles per gallon: 3., 22.7, 21.4, 20.6, and 21.4. 20.9. Find the mode for these data.
- Periodically, the county Water Department tests the drinking water of homeowners for contaminants such as lead and copper. The lead and copper levels in water specimens collected in 1998 for a sample of 10 residents of a subdevelopement of the county are shown below. lead (μμg/L) copper (mg/L) 4.4 0.643 2.4 0.57 1.5 0.46 2.6 0.895 5.9 0.2 3.4 0.54 3.8 0.245 1.6 0.583 5.7 0.769 1.7 0.215 (a) Construct a 9999% confidence interval for the mean lead level in water specimans of the subdevelopment. ≤μ≤How sensitive to changes in water temperature are coral reefs? To find out, scientists examined data on sea surface temperatures, in degrees Celsius, and mean coral growth, in centimeters per year, over a several‑year period at locations in the Gulf of Mexico and the Caribbean Sea. The table shows the data for the Gulf of Mexico. Sea surface temperature 26.726.7 26.626.6 26.626.6 26.526.5 26.326.3 26.126.1 Growth 0.850.85 0.850.85 0.790.79 0.860.86 0.890.89 0.920.92 (b) Find the correlation ?r step by step. Round off to two decimals places in each step. First, find the mean and standard deviation of each variable. Then, find the six standardized values for each variable. Finally, use the formula for ?r . Round your answer to three decimal places.Periodically, the county Water Department tests the drinking water of homeowners for contaminants such as lead and copper. The lead and copper levels in water specimens collected in 1998 for a sample of 10 residents of a subdevelopement of the county are shown below. lead (μμg/L) copper (mg/L) 4.44.4 0.6430.643 2.42.4 0.570.57 1.51.5 0.460.46 2.62.6 0.8950.895 5.95.9 0.20.2 3.43.4 0.540.54 3.83.8 0.2450.245 1.61.6 0.5830.583 5.75.7 0.7690.769 1.71.7 0.2150.215 (a) Construct a 9999% confidence interval for the mean lead level in water specimans of the subdevelopment. ≤μ≤≤μ≤ (b) Construct a 9999% confidence interval for the mean copper level in water specimans of the subdevelopment. ≤μ≤≤μ≤
- An article in the Journal of Environmental Engineering (1989, Vol. 115(3), pp. 608–619) reported the results of a study on the occurrence of sodium and chloride in surface streams in central Rhode Island. The following data are chloride concentration y (in milligrams per liter) and roadway area in the watershed x (in percentage).The article “Effect of Internal Gas Pressure on the Com- pression Strength of Beverage Cans and Plastic Bottles” (J. of Testing and Evaluation, 1993: 129–131) includes the accompanying data on compression strength (lb) for a sample of 12-oz aluminum cans filled with strawberry drink and another sample filled with cola. Does the data suggest that the extra carbonation of cola results in a higher average compression strength? Base your answer on a P-value. What assumptions are necessary for your analysis? ( use ? = 0.01 )The determination of the shear strength of spot welds is relatively difficult, whereas measuring the weld diameter of spot welds is relatively simple. As a result, it would be advantageous if shear strength could be predicted from a measurement of weld diameter. The data are as follows: Shear strength (psi) Weld diameter (0.0001 in) 370 400 780 800 1210 1250 1560 1600 1980 2000 2450 2500 3070 3100 3550 3600 3940 4000 3950 4000 a) Test the hypothesis that the slope of the regression line is equal to 1 at the 0.05 level of significance.
- Periodically, the county Water Department tests the drinking water of homeowners for contminants such as lead and copper. The lead and copper levels in water specimens collected in 1998 for a sample of 10 residents of a subdevelopement of the county are shown below. lead (μμg/L) copper (mg/L) 4.44.4 0.4840.484 2.72.7 0.0760.076 5.35.3 0.5950.595 3.33.3 0.1280.128 5.55.5 0.4690.469 1.71.7 0.4060.406 0.40.4 0.8480.848 0.70.7 0.0220.022 44 0.860.86 2.82.8 0.4250.425 (a) Construct a 99% confidence interval for the mean lead level in water specimans of the subdevelopment. blank≤μ≤blank (b) Construct a 99% confidence interval for the mean copper level in water specimans of the subdevelopment. blank≤μ≤blankThe table below shows the results from the specific gravity (S.G.) test performed in a soil laboratory including twenty samples of sand. Determine the Coefficient of Quartile Variation.Two quality control technicians measured the surface finish of a metal part, obtaining the data in the table below. Assume that the measurements are normally distributed.
