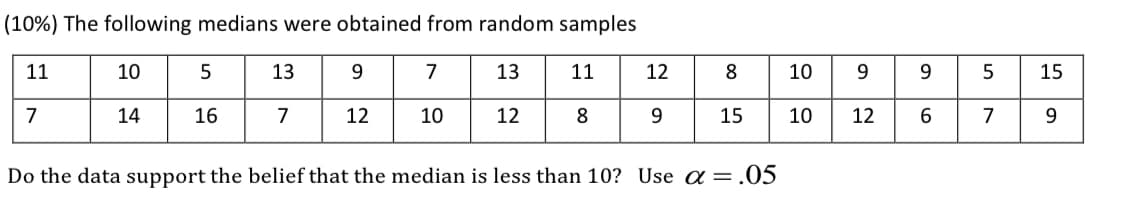
(10%) The following medians were obtained from random samples 11 10 13 9. 7 13 11 12 8 10 9 9. 15 7 14 16 7 12 10 12 8 9 15 10 12 6. 7 Do the data support the belief that the median is less than 10? Use a = .05
Q: 4. Calculate the mean deviation (from median) from the following data and also calculate its co-…
A:
Q: From the following data compute Quartile Deviation : Size : 4- 7 8-10 11-13 14-16 17-19 Frequency 14…
A:
Q: The following times were recorded by the quarter-mile and mile runners of a university track team…
A: Let quarter mile times be denoted as sample 1 and mile times be denoted as sample 2. Let x1 and s1…
Q: use following sample home prices ($000s) to answer the questions; 175.0 48.8 995.9 298.0 218.9 209.0…
A: Hello. Since your question has multiple sub-parts, we will solve first three sub-parts for you. If…
Q: The following set of data is from a sample of n = 7. 7 3 4 12 8 3 5 0 a. Compute the mean, median,…
A: (a) Use EXCEL Procedure for finding the values of mean, median and mode. Follow the instruction…
Q: The following data represents the percentages of family income allocated to groceries for a random…
A: Mean: It is the sum of the observations divided by the total number if observations. Median: It is…
Q: Suppose the accompanying summary statistics for a measure of social marginality for samples of…
A:
Q: Q2. From the following data below. 17 19 21 18 20 18 19 20 20 21 1. What is the mean? (а) 19.9 (b)…
A: Given data: 17, 19, 21, 18, 20, 18, 19, 20, 20, 21 (1) Mean is the sum of observations divided by…
Q: A manufacturer company has collected the number of employees for the following weekly wage: Number…
A: Descriptive Statistics gives the brief summary of the data.
Q: 6. The following data is given: Average Domestic animals Number of Types of Animals Standard…
A:
Q: Use the following information to answer the question. The distribution of the number of hours people…
A: Given: Population mean μ=8 Population standard deviation σ=0.5 Number of hours worked = 8.7
Q: * :For the following distribution calculate the mean, median, lower quartil, node and standard…
A: Descriptive Statistics describes the characteristics of the dataset. Since you have posted a…
Q: From the following data relating to the daily wages of 15 workers in a factory. Wage in RO 14, 16,…
A: Mean = (summation Xi)/n Here n= 15 Mean= (14+16+16+14+22+13+15+24+12+23+14+20+17+21+22)/15 = 17.53
Q: Consider the following sample: 10 12 14 20 31 35 40 40 55 55 57 63…
A: Solution: From the given information, the mean is 47.1250 and standard deviation is 26.1938.
Q: used data from the Social Security records to study the average monthly benefit for a specific year…
A: Given, Sample size retired, n1= 63 Sample size disabled, n2=60 Mean benefit retired, x1=$960.50 Mean…
Q: For the following sample of scores: 12 9. 17 2 7 The standard deviation is: Select one: 9.4 4.93 O 9…
A:
Q: The following observations were randomly sampled from a Normal distribution. Using this data,…
A: Confidence interval give a range of values for the unknown parameter of the population. The width of…
Q: The following data were obtained from an independent-measures research study using three treatment…
A:
Q: Treatment II II n 8 n 4 N = 18 T 16 24 32 G 72 SS 40 SS = 24 SS 16 ΣΧ2 464 || || ||
A: Given: α=0.05 Treatment I: n=8, T=16, SS=40 Treatment II: n=6, T=24, SS=24 Treatment III: n=4, T=32,…
Q: Consider the following sample: 10 35 41 50 59 69 73 76 91 the mean and sample…
A:
Q: The following sample data represent the number of paid days off taken by eight employees at a small…
A: From the provided information, Population mean (µ) = 15 Sample size (n) = 8 The mean and standard…
Q: Consider the following sample: 15 24 25 29 31 36 73 85 94 96 100 the mean…
A:
Q: For the following data set, approximate the sample standard deviation of distances from O A. 4.9…
A: It is an important part of statistics. It is widely used.
Q: 4. The following data are the temperatures (in °C) of effluent at discharge from a sewage treatment…
A:
Q: Q2-B) from the following values make frequency distribution and find the a. Median ? b. Mode ? 24.9…
A: Frequency distribution: The number of values lying in the particular interval or the number of times…
Q: 4. Compute coefficient of quartile deviation from the following data : Marks 10 20 30 40 No. of…
A:
Q: The following are historical data on staff salaries (dollars per pupil) for 30 schools sampled in…
A:
Q: The following are observations on the number of monthly Zoom sessions attended by a sample of 10…
A: Standard deviation is a measure of dispersion and important measure of dispersion. It used to…
Q: The following set of data is from a sample of n =7. 7 0 4 2 9 0 13O a. Compute the mean, median, and…
A:
Q: The following data were collected as part of a study of coffee consumption among graduate students.…
A: It is given that the reflect cups per day consumed is 3, 4, 6, 8, 2, 1, 0, and 2.
Q: In an attempt to compare the performance of students with more than one electronic gadget and those…
A: A hypothesis test is an inference method which is used to make an estimation of population…
Q: g populstion of N=9 scores 4,2,0,5,3,2,1,7,3 C. compute ss, variane and standard deviation for the…
A: The mean is: The table that shows the necessary calculations is depicted as follows: x x−μ…
Q: Which of the following statements best describes the % confidence that the sample intervals in…
A: Given: The graph showing ten samples and corresponding confidence intervals.
Q: A random sample of patients visiting a hospital emergency room was obtained and the waiting time of…
A:
Q: For the following samplea. Assume that the scores are measurements of acontinuous variable and find…
A: a. Assume that the scores are measurements of a continuous variable. Excel Procedure: Enter…
Q: Compute cocfficient of quartile deviation from the following data: 50 Marks 10 40 80 30 15 20 No. of…
A: Given The data is as follows: Marks No. of students 10 4 20 7 30 15 40 8 50 7 80 2
Q: The following data were collected from 10 randomly selected patients undergoing physical therapy…
A: As per our guidelines we can solve first three subpart of question and rest can be reposted.…
Q: Q5 Calculate Quartile Deviation and its Coefficient from the following data
A: Here given frequency distribution of weight Here use quartile deviation and it's coefficient…
Q: Q2/ The number of faculty listed for a variety of private colleges that offer only bachelor's…
A: The number of faculty listed for a variety of private colleges that offer only bachelor's degrees is…
Q: The following times were recorded by the quarter-mile and mile runners of a university track team…
A:
Q: 10 8 6 14 22 13 17 19 5 16 11 9 18 14 13 12 15 15 11 11
A:
Q: For the following sample of n=8 scores find the meand and the standard deviation. 0,2,1,0,6,1,0,2…
A: Given data 0,2,1,0,6,1,0,2 Mean is given by
Q: For the following sample of n=6 scores, which is most likely to be considered an outlier? [6, 4, 5,…
A: To find: Q1; Outlier Q2; Standard deviation Q3; Test Statistics and critical value
Q: For the following data find the Standard deviation of the sample(round to the nearest tenths place)…
A: Given data is23,20,19,27,18,30,28,28,24,24,20,40,57,18,20,23,23,24,25,27sample size(n)=20
Q: 6. The following data is given: Number of animals 15 5 5 Average Domestic animals 2 Types of Animals…
A: Types of Animal n x s s2 Dogs 5 2 1 1 Cats 5 3 1.87 3.4969 Hamster 5 4 1.41 1.9881 p = 3 n…
Q: Compute coefficient of quartile deviation from the following data : Marks 10 20 30 40 50 60 No. of…
A:
Q: In an educational study, there is interest in whether or not there is more variability in the mean…
A: Given information: The descriptive statistics of two groups of children 3-year-olds and 8-year-olds…
Q: Consider the following sample: 10 22 63 70 98 the mean and sample standard deviation…
A: Given: Mean = μ = 52.6000 Standard deviation = σ = 36.1359.
Q: What is the standart-deviation of the following data? (select the closest value) Class Frequency 2.7…
A: The table that shows the calculations is shown below: The sample mean is calculated as follows:
Q: The following times were recorded by the quarter-mile and mile runners of a university track team…
A: Use EXCEL Procedure to obtain the value of standard deviation for the quartile mile runners Follow…
Step by step
Solved in 2 steps with 1 images