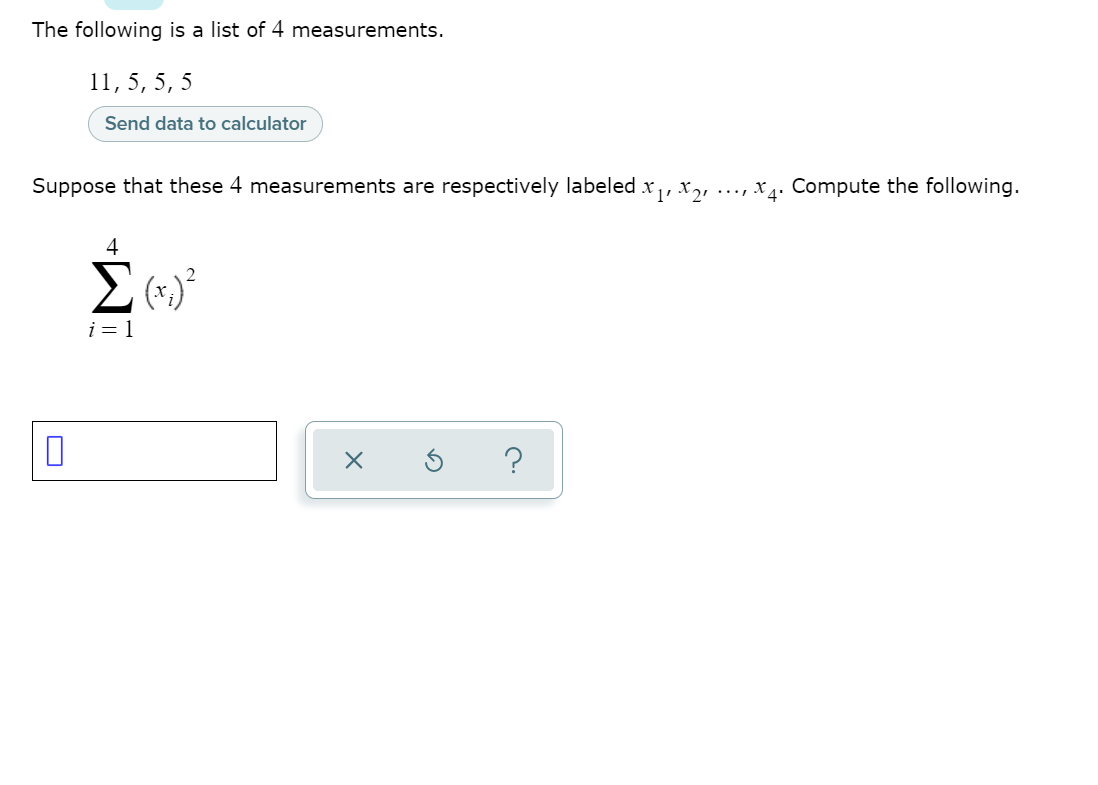
11, 5, 5, 5 Send data to calculator Suppose that these 4 measurements are respectively labeled x, x,, ..., x4: Compute the following. i = 1


Q: 5. Identify each of the following examples as attribute qualitative) or numerical (quantitative)…
A: 5.a). The given case in point is an attribute since the residence for each pupil is not usually…
Q: Suppose IQ scores were obtained for 20 randomly selected sets of siblings. The 20 pairs of…
A: Reviewing information, Given, x : IQ score of the younger child…
Q: The following is a list of 10 measurements. 59, 37, -1, -71, 80, 88, -24, 30, -30, 51 Send data to…
A: Given that x1 = 59, x2 = 37, x3 = -1, x4 = -71, .........,x10 = 51
Q: The following is a list of 4 measurements. 15, 13, 15, 18 Send data to calculator Suppose that these…
A:
Q: 7. Find the Q.D. and coefficient of Q.D. from the following data. auou Size Frequency 3.5 4.5 5.5…
A:
Q: le indistinguishable particles are to be distributed among the 4 equally spaced wn in the table)…
A:
Q: The following is a list of 10 measurements. 56, -75, 92, -60, -31, 81, 87, 58, -87, 15 Send data to…
A:
Q: Let X1 be the sample mean of a random sample of size n from a Norinal(µ, o†) population and X2 be…
A: A statistic t is said to be an unbiased estimate of a parameter θ if Et=θ. Given μ^=ω X¯1+1-ωX¯2…
Q: The following is a list of 11 measurements. 13, 28, -7, 91, -82, 37, -92, -62, 13, 24, 97 Send data…
A: We have given that, The list of 11 measurements is, 13, 28, -7, 91, -82, 37, -92, -62, 13, 24, 97…
Q: 5. From the data given below, find the number of items n. r= +0.5, Exy = 120, o, = 8, Er = 90 where…
A:
Q: The following is a list of 10 measurements. -71, 21, 40, -17, -36, 50, 81, 76, -81, -85 Send data to…
A: List of 10 measurements-71,21,40,-17,-36,50,81,76,-81,-85there 10 measurement labeled as…
Q: Suppose X1,..., X30 following estimators for p: Bin(1, p), where p is an unknown parameter. We…
A: Hello! As you have posted more than 3 sub parts, we are answering the first 3 sub-parts. In case…
Q: Consider a random poker hand of 5 cards. Let X be the number of Hearts in this hand, and let Y be…
A: There are 13 hears, 13 diamonds and 26 cards that are neither hearts or diamonds in a deck of 52…
Q: Let {e,, e, ***, e,} be a random sample of e. e- N(0, o'), where o >0. Let Y,-a+ e,, for i-1,nand…
A: Given that, e1,e2,...,en~N(0,σ2)Where, σ2>0Yi=α+ei ; i=1:n
Q: 67. Recently, the annual number of driver deaths per 100,000 for the selected age groups was as…
A:
Q: The following is a list of 15 measurements. 66, – 3, 90, 51, –97, 68, – 17, – 3, - 68, – 8, 77, –…
A: A list of 15 measurements are 66, -3, 90, 51, -97, 68, -17, -3, -68, -8, 77, -57, 86, 35, -63.
Q: In the figure below, How many measurements in a data set that subject to a random error and lies in…
A: We've to find that, P(-2.38<Z<2.36)' =1- P(-2.38<Z)- P(Z<2.36) =1-…
Q: Examine the following figure, which displays hypothetical measurements of a sample of individuals…
A: Horizontal axis : A,B,C Vertical axis : 0 to 10 (with gap of 2.5) A ( majority lie between 1 to 5,…
Q: mple 1, 2, n) 0, and that E(e") = a + r0, Var(e") : r = 1, 2, .., n (a) Find the appropriate…
A: Let Yr=E(ezr)E(Yr)=α+rθ.r=1,2,...nVar(Yr)=σ2r,r=1,2,..nYr=α+rθ+εr, r=1,2,..nResidual sum of…
Q: The following is a list of 11 measurements. - 89, 18, -21, -85, -3, -21, -94, -43, -45, -44, -25…
A: Number of observations=11 The given observations are -89,18,-21,-85,-3,-21,-94,-43,-45,-44,-25 The…
Q: 2. A normally distributed data has a mean µ = 45 ando = 6. Find the value of X that has 13% of the…
A: Given Normal distribution mean = 45 Standard deviation = 6
Q: i.i.d. Suppose X1,..., X, Uniform[0, 0] with unknown 0. Consider the following three estima- tors…
A: Hello! As you have posted more than 3 sub parts, we are answering the first 3 sub-parts. In case…
Q: The following stem-and-leaf plot represents the test scores for 26 students in a class on their most…
A: Here number of students , n = 26 In a stem and leaf plot, the values are in ascending order The…
Q: The following is a list of 15 measurements. 17, -71, – 11, - 63, – 21, 84, – 2, – 89, 36, 30, 65,…
A: Given data set, =?
Q: en} be a random sample of e. e~ N(0, o²), where o >0. Let Y, = a+ e;, for Let {e,, e2, ', i = 1,…
A: Answer: a. G is an unbiased estimator.
Q: The following s a list of 6 measurements. 13, 18, 16, 7, 7, 12 Suppose that these 6. measurements…
A: According to the provided information, the list of measurements are: 13, 18, 16, 7, 7, 12
Q: The cross-table created after the observations made according to the patients' post-treatment…
A: Any assumption about the parameter or probability function is known as hypothesis testing. For the…
Q: 3- You are given a data set for test scores that have a x̅= 27 and s= 4.2- you must compute the raw…
A: It is given that mean is 27 and standard deviation is 4.2.Raw score of 3.1 is calculated as follows:
Q: pp. 986-990), researchers reported on a study of the effects of r draw in a magnetic core by…
A:
Q: HW.2 Find ylo.u), y (4.8) , y (19) ,y(2.1) for the hllowing data in the below table 2 4 5 6 1 -2…
A:
Q: Estimate a sample for a population of 5,000 inhabitants based on the following parameters: 1. Z^2…
A:
Q: (21) Let X b (12,5) find E(5+6x) and distribution function.
A: Given,X≈b(12,23 )E(x)=npE(x)=12×23 E(x)=8
Q: The assumption that is required to shows the efficiency of the OLS estimator, consistency and…
A: Hey there.! thank you for posting your question.
Q: 1 b) For any data set, approximately 95% of the observations fall in the interval (T − 2s, T+2s).…
A:
Q: The following is a list of measurements. 14, 18, 20, 17, 14 Suppose that these ) measurements are…
A: Let "xi" is the list of measurements. xi 14 18 20 17 14
Q: uestion 1 Vhich of the following would be the LSRL for the given data? x2 7 8 11 17 16 y 23 28 40 28…
A: We want to find the regression equation
Q: In this example with the help of the following details in the table of the 6 people having a…
A: Given that,
Q: The process of drawing conclusions about a population on the basis of measurements or observations…
A: Given Information: The process of drawing conclusions about a population on the basis of…
Q: Consider the model y=1+e where for X = {r1, ... , IN}, and for all i, E (e,|X) = c # Which of the…
A: From the given information, Here, the ols estimator is unbiased estimator. Hence, the option "the…
Q: Exercise 6. Using the MGF given by Equation (24), deduce the expressions for the mean and variance…
A:
Q: The following is a list of 6 measurements. 15, 19, 7, 11, 17, 13 Send data to calculator Suppose…
A: The given data is 15, 19, 7, 11, 17, 13
Q: The following is a list of 12 measurements. -44, -10,-77, 9, 49, -94, -59, -6, 15, 16, -74, 6 Send…
A: Solution-: We have following data: - 44, -10, -77, 9, 49, -94, -59, -6, 15, 16, -74, 6 We want to…
Q: The following is a list of 15 measurements. -39, 51, -6, -78, -41, -86, -51, -20, 91, 75, -28, 19,…
A: The measurements are x1 = -39, x2 = 51, x3 = -6, x4 = -78,......., x14 = 87, x15 = 21
Q: Consider data Y1, Y2, . . . , Yn iid∼ Ber(p). Answer parts a and b of the following question. a.)…
A: Given problem is : Consider data Y1, Y2, . . . , Yn iid∼ Ber(p). Answer parts a and b of the…
Q: The following is a list of 6 measurements. 11, 17, 7, 8, 16, 20 Send data to calculator Suppose that…
A: Here we need to find the summation of the given data set.
Q: Use the information given in the table below to find a 95% Prediction Interval for y when x = 1 In =…
A: Answer:- Option A is correct answer.
Q: The following table consists of one student athlete's time, x, (in minutes) to swim 2,500 yards and…
A: Given - x is athlete's time (in minutes) to swim 2,500 yards y is heart rate (beats per minute)
Q: A researcher wants to compare three different exercise programs. For each program, five volunteers…
A:
Q: Consider drawing samples of sizen = 12 from U(0,12) Consider estimators for the population variance.…
A: n = 12 X ~ U(0,12)
Q: The following is a list of 10 measurements. -9, 50, 99, -49, 12, -42, -61, -57, -15, -41 Send data…
A: The following is a list of 10 measurements. -9, 50, 99,-49, 12, -42,-61,-57, -15,-41


Trending now
This is a popular solution!

Step by step
Solved in 2 steps


- Consider the following data. Do heavier cars really use more gasoline? Suppose a car is chosen at random. Let x be the weight of the car (in hundreds of pounds), and let y be the miles per gallon (mpg). The following information is based on data taken from Consumer Reports (Vol. 62, No. 4).A sample of 25 observations provides the following statistics sx=16,sy=19 and sxy=118.69. Calculate the value of the Test statistic (Round intermediate calculations to at least 4 decimal and final answer to 3 decimal places.)If the value of Cronbach’s alpha is 0.07, it means ___________; a. Research instrument is not reliable b. Research instrument is internally consistent c. Data is reliable d. Data is internally consistent
- andres asked if there is a relationship between the quality of sneakers worn by a sample of 20 volleyball players and their average number of point scored per game. he computed r= +.21 and immediately claimed he had evidence that better-quality sneakers are related to better performance (a) is his claim correct? why? (b) what are Ho and Ha? (c) with alpha=.05, what is rcrit ?The cross-table created after the observations made according to the patients' post-treatment conditions with four different treatment techniques is as follows. if α=0.05 is taken, which of the following is true about the independence test of these variables? treatment techniquepatient status A B C D totalit got better 25 30 40 23 118 did not recover 25 20 10 27 82 total 50 50 50 50 200 A)The Chi-Square calculated is = 14.30. B)The Chi-square table value is=9.35. C)e13=20.5. D)The degree of freedom is = 8.Two analysts were given a standard reference material (SRM) and were asked to determine its copper concentration (in mg/kg) using the EPA standard method. Each analyst was given sufficient time so they could produce as many accurate results as possible. Their results (mg/kg) were as follows: Analyst A 45.2, 47.3, 51.2, 50.4, 52.2, 48.7 (Standard error s = 2.62) Analyst B 49.4, 50.3, 51.6, 52.1, 50.9 (Standard error s = 1.06) (a) For Analyst A, is 52.2 mg/kg a possible outlier? (b) Calculate the RSD for each student; which analyst is more precise? (c) If the known concentration of copper in SRM is 49.5 mg/kg, which analyst is more accurate (without considering the deletion of outliers if any)?
- The following stamp and leaf plot represents the terms in minutes required for 26 call workers to commute to work use the data provided to find the quartile.. Find the 1st quartile.The owner of a new car conducts a series of six gas mileage tests and obtains the following results, expressed in miles per gallon: 3., 22.7, 21.4, 20.6, and 21.4. 20.9. Find the mode for these data.A sample of average high temperature during July (x) of cities in Colorado compared to their elevation in feet (y) yields the following results: x 90 75 85 94 89 94 78 76 88 y 5280 9494 6035 4078 6191 4583 8000 8022 5807 Find x^2