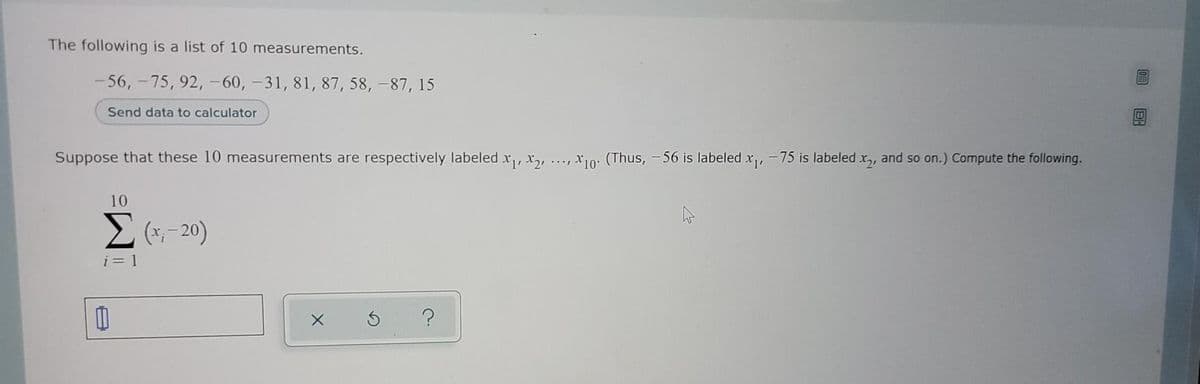
The following is a list of 10 measurements. 56, -75, 92, -60, -31, 81, 87, 58, -87, 15 Send data to calculator Suppose that these 10 measurements are respectively labeled x, x, ..., x10: (Thus, - 56 is labeled x, -75 is labeled x,, and so on.) Compute the following. 10 E(-20) i= 1


Q: The following is a list of 14 measurements. 84, – 77, 39, 26, – 74, – 5, - 27, – 73, – 89, – 37, –…
A: Summation (Xi/46)= (1/46)* summation (Xi) We add all the Observation first then we divide the sum by…
Q: 1. Given X = (33, 32, 32, 30, 29, 29, 28, 27,27, 25, 25, 25, 25, 24, 24, 22, 21, 20, 18, 18), use µx…
A: As per Bartleby's answering policy, we can answer only one question with a maximum of three…
Q: The following is a list of 10 measurements. -22, 11, 75, 5, 70, -75, -98, 92, 40, -1 Suppose that…
A: For the computation, subtract each value from 40 and add the differences.
Q: The following is a list of 10 measurements. 59, 37, -1, -71, 80, 88, -24, 30, -30, 51 Send data to…
A: Given that x1 = 59, x2 = 37, x3 = -1, x4 = -71, .........,x10 = 51
Q: The following is a list of 4 measurements. 15, 13, 15, 18 Send data to calculator Suppose that these…
A:
Q: The following is a list of 14 measurements. -34, 82, -33, -7,-28, -26,-82,-44, -9, 6, 84, 41, -87,…
A: Given: The 14 measurements are -34, 82, -33, -7, -28, -26, -82, -44, -9, 6, 84, 41, -87, 73. The…
Q: On Assignment 11.15, you found the mean and standard deviation for X, the number of dots facing up…
A: Given: μ=3.5σ=1.7078
Q: le indistinguishable particles are to be distributed among the 4 equally spaced wn in the table)…
A:
Q: Compute for the standard elemental time using the given data: Actual Time = 10.5 sec, Performance…
A: Given : Actual time = 10.5 sec Performance rating = 1.05 Fatigue allowance = 15 %
Q: The following is a list of 11 measurements. 13, 28, -7, 91, -82, 37, -92, -62, 13, 24, 97 Send data…
A: We have given that, The list of 11 measurements is, 13, 28, -7, 91, -82, 37, -92, -62, 13, 24, 97…
Q: Question 2: A magazine article reported that 11% of adults buy takeout food every day. A fast-food…
A:
Q: The following is a list of 10 measurements. -71, 21, 40, -17, -36, 50, 81, 76, -81, -85 Send data to…
A: List of 10 measurements-71,21,40,-17,-36,50,81,76,-81,-85there 10 measurement labeled as…
Q: 1. A T interval for the difference of 2 population means was obtained on the TI, as shown below.…
A: Given the T interval for the difference of 2 population means as -21.17, 81.168
Q: greater than 30 parts per billion. To test this estimate, you determine the 29 17 44 23 22 35 23 17…
A: For the given Sample : The Standard Deviation, s : 9.195 Null and Alternative Hypotheses The…
Q: The following is a list of 15 measurements. 66, – 3, 90, 51, –97, 68, – 17, – 3, - 68, – 8, 77, –…
A: A list of 15 measurements are 66, -3, 90, 51, -97, 68, -17, -3, -68, -8, 77, -57, 86, 35, -63.
Q: i.e. P(>50) = P(X-9 olun But we know that Z=-4 oi√n - →210,1) = P(Z > Sone rivn from given data, ) =…
A: Given,sample size(n)=7mean(μ)=65.33standard deviation(σ)=31.59
Q: a) the following data are taken from the steam table. 140 Temp. °C, t 150 160 170 180 Ptessure, p…
A: Use the standard equation of regression line. Determine the value of the variables using their…
Q: Given are the scores of 10 employees from their 20-point assessment 16 18 10 8 12 15 19 17 167…
A:
Q: 2. Determine the approximate value of y if x = 1.5 for the data set {(-1, 5), (0, 1), (1, 1), (2,…
A:
Q: An engineer who accidentally inhaled poisonous fumes was given treatment for it. The concentration…
A: Let us determine after how many days the engineer will join work with the help of the information…
Q: E (x. - x Y Show that is a consistent estimator for o is N (µ, o²).
A: ANSWER: For the given data,
Q: Compute the GPA for the following student. Letter Grade Value Frequency A 4 37 B 3 32…
A: Solved below
Q: The following is a list of 11 measurements. - 89, 18, -21, -85, -3, -21, -94, -43, -45, -44, -25…
A: Number of observations=11 The given observations are -89,18,-21,-85,-3,-21,-94,-43,-45,-44,-25 The…
Q: The following is a list of 15 measurements. 17, -71, – 11, - 63, – 21, 84, – 2, – 89, 36, 30, 65,…
A: Given data set, =?
Q: The following is a list of 4 measurements. 9, 15, 11, 17 Send data to calculator Send data to Excel…
A: Find sum of squares of observations 9,15,11,17
Q: 5. For a population with µu = 40 and o = 11, find the z-score for each of the following X values.…
A: Solution
Q: We know that the point estimator o` is an unbiased estimator for the parameter 0 if E(e') = 0.If the…
A: Unbiased estimator: Any statistic is said to be an unbiased estimator of the specified parameter, if…
Q: The following s a list of 6 measurements. 13, 18, 16, 7, 7, 12 Suppose that these 6. measurements…
A: According to the provided information, the list of measurements are: 13, 18, 16, 7, 7, 12
Q: estimate of the average monthly housing cost for a graduate student at UoN. Fro graduate students, a…
A: In this case, the researcher is interested to know about the average monthly housing cost for a…
Q: Q. 18. Calculate mode from the following 15 observations : 5, 4, 8, 7, 12, 18, 17, 30, 8, 12, 20,…
A:
Q: For cross 2: Total (N) = 583 4 = ר Expected (E) frequency = Total/n = 583/4 = 145.75 %3D %3D…
A: Given: N=583. n=4. The value of the chi-square test statistic χ2=250.2419.
Q: Verify the following statistical identities: a) E (T; – T)² = E1 x} – nữ² b) E1(C; – T)(y: – 9) =…
A: Since you have posted a question with multiple sub-parts, we will solve first three sub-parts for…
Q: The following is a list of measurements. 14, 18, 20, 17, 14 Suppose that these ) measurements are…
A: Let "xi" is the list of measurements. xi 14 18 20 17 14
Q: The following X chart depicts the last 50 samples taken from the output of a process. Using the…
A: Western electric rule: Any single data point that plots outside the 3-sigma controls from the…
Q: The following is a list of 15 measurements. -16, -39, -6, –-47, 24, -65, –80, 29, 74, 53, 50, 26,…
A:
Q: The following is a list of 14 measurements. - 13, -6, -45, 53, –3, 83, –23, 79, – 17, –96, – 18, 91,…
A: Given: A list of 14 measurements. -13,-6,-45,53,-3,83,-23,79,-17,-96,-18,91,53,-13
Q: Consider the model y=1+e where for X = {r1, ... , IN}, and for all i, E (e,|X) = c # Which of the…
A: From the given information, Here, the ols estimator is unbiased estimator. Hence, the option "the…
Q: The following is a list of 6 measurements. 15, 19, 7, 11, 17, 13 Send data to calculator Suppose…
A: The given data is 15, 19, 7, 11, 17, 13
Q: The following is a list of ) measurements. 13, 5, 15, 20, 15 Suppose that these 5 measurements are…
A:
Q: The following is a list of 12 measurements. -44, -10,-77, 9, 49, -94, -59, -6, 15, 16, -74, 6 Send…
A: Solution-: We have following data: - 44, -10, -77, 9, 49, -94, -59, -6, 15, 16, -74, 6 We want to…
Q: A manufacturer of downhill and cross-country skis reports that manufacturing time is 2 hours and 3…
A:
Q: e are two sources of uncertainty: (i) der. Fill in the following table to illu the following table,…
A: A currency forward is a binding contract and the parties involved have to fulfill their part of the…
Q: Listed below are body temperatures from five different subjects measured at 8 AM and again at 12 AM…
A:
Q: The following is a list of 15 measurements. -39, 51, -6, -78, -41, -86, -51, -20, 91, 75, -28, 19,…
A: The measurements are x1 = -39, x2 = 51, x3 = -6, x4 = -78,......., x14 = 87, x15 = 21
Q: The variable X, is the carbon monoxide concentration in air, and ten measurements are obtained as…
A: Let (xi; i=1,2,...,n) be the random sample of size n from the normal population with mean μ and…
Q: The following is a list of 6 measurements. 11, 17, 7, 8, 16, 20 Send data to calculator Suppose that…
A: Here we need to find the summation of the given data set.
Q: 11, 5, 5, 5 Send data to calculator Suppose that these 4 measurements are respectively labeled x,…
A: 4 measurements are there 11,5,5,5. We need to find the sum of squares of the numbers.
Q: **28. Consider the following: rxy = .85, Y = 40, Su = 6. Y' = 36. What is the range within which one…
A: c is the very much correct option that is 30-42
Q: The following is a list of 10 measurements. -9, 50, 99, -49, 12, -42, -61, -57, -15, -41 Send data…
A: The following is a list of 10 measurements. -9, 50, 99,-49, 12, -42,-61,-57, -15,-41

Step by step
Solved in 2 steps with 2 images


- The following is a list of 12 measurements.- 44, -10, -77, 9, 49, -94, -59, -6, 15, 16, -74, 6 Suppose that these 12 measurements are respectively labeled r,, r, .., t12. (Thus, - 44 is labeled xy, - 10 is labeled ty, and so on.) Compute the following.To increase egg production, a farmer decided to increase the number of times the lights in his henhouse were on. Ten hens were randomly selected, and the number of eggs each produced was recorded. After one week of lengthened light time, the same hens were monitored again. The data is given here. At α = 0.05, can it be concluded that the increased light time increased egg production? Hen 1 2 3 4 5 6 7 8 9 10 Before 4 3 8 7 6 4 9 7 6 5 After 6 5 9 7 4 5 10 6 9 6Suppose that these 12 measurements are respectively labeled, x2, …, x12. (Thus, −6 is labeled x1, −9 is labeled x2, and so on.) Compute the following.
- 2. Determine the approximate value of y if x = 1.5 for the data set {(-1, 5), (0, 1), (1, 1), (2, 11)} by Newton’s divided difference interpolation. Round off to three decimalsA paper describes an investigation in which 40 men and 40 women with online dating profiles agreed to participate in a study. Each participant's height (in inches) was measured and the actual height was compared to the height given in that person's online profile. The differences between the online profile height and the actual height (profile − actual) were used to compute the values in the accompanying table. Men Women xd = 0.53 xd = 0.08 sd = 0.81 sd = 0.75 n = 40 n = 40 For purposes of this exercise, assume it is reasonable to regard the two samples in this study as being representative of male online daters and female online daters. (Although the authors of the paper believed that their samples were representative of these populations, participants were volunteers recruited through newspaper advertisements, so we should be a bit hesitant to generalize results to all online daters.) Use the two-sample t test of Section 11.1 to test H0: ?m − ?f…Compute for the x-scores of the following: 1. z = 1.35, μ = 285.75, and σ = 17.4 2. z = -0.45, μ = 78.30, and σ = 16 3. z = -2.44, μ = 102.63, and σ = 35 4. z = 1.72, μ = 283.39, and σ = 24.5
- The following data are for the throughput, as measured by the number of wafer lots produced per day by different operators (A, B, C, and D) on different machines (each operator used each machine on two different days): Eighty-four working days were needed to collect the data. The numbers in parentheses refer to the days on which the results were obtained. For example, on the first day, operator A produced 17 lots using machine 2, and on the 84th day, operator A produced 18 lots using machine 5. On some days (such as the third day), more than one item of data was collected, and on other days (such as day 40), no data was collected. Analyze the data, stating all assumptions and conclusions.Calculate the z and the p-value for each of the following. Thanks!For each of the following tobs values, determine the highest level ofsignificance associated with the decision taken. NB please show calculations tbs df decision 4.000 17 Reject Ha for a two-tailed test 1.200 120 Reject Ha for a one-tailed test -2.666 16 Reject for both one-tailed and two-tailed test
- The cross-table created after the observations made according to the patients' post-treatment conditions with four different treatment techniques is as follows. if α=0.05 is taken, which of the following is true about the independence test of these variables? treatment techniquepatient status A B C D totalit got better 25 30 40 23 118 did not recover 25 20 10 27 82 total 50 50 50 50 200 A)The Chi-Square calculated is = 14.30. B)The Chi-square table value is=9.35. C)e13=20.5. D)The degree of freedom is = 8.A sample of n= 64 scores has a mean of M= 68. Assuming that the population mean is u=60, find the z-score for this sample: If it was obtained from a population with o= 16 Z=Strack, martin and Stepper (1988) reported that people rate cartoons as funnier when holding a pen in their teeth (Which force them to frown.) a researcher attempted to replicate this result using a sample of n = 30 adults between the ages of 32-37. For each person, the researcher recorded the difference between the rating obtained while smiling and the rating obtained while frowning. On the average cartoons were rated as funnier when the participants were smiling, with an average difference of 2.6 with SS = 200. a) Do the data indicate that the cartoons are rated significantly funnier when the participants are smiling? Use a two tailed test with α = 0.05. (Use the four logical steps in hypothesis testing) b) Compute for r2 to measure the size of the treatment effect. c) Write a sentence describing the outcome of the hypothesis test and the measure of effect size as it would appear in a research paper.