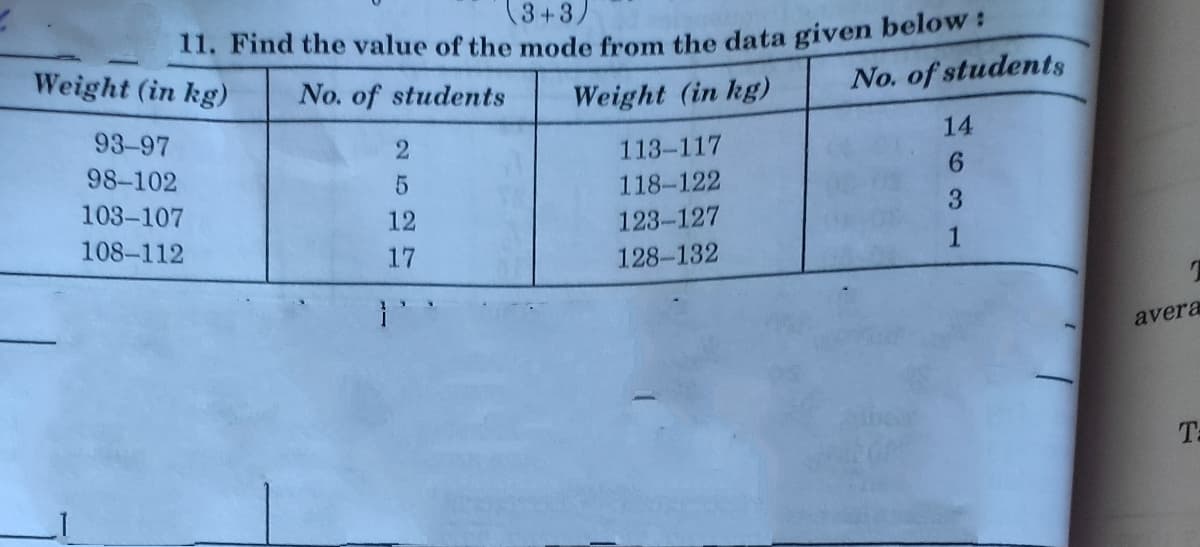
11. Find the value of the mode from the data given below Weight (in kg) No. of students No. of students Weight (in kg) 14 93-97 113-117 6. 98-102 118-122 103-107 12 123-127 1 108-112 17 128-132 25
Q: Please answer the whole question. (1) Let x be the age in years of a licensed automobile driver.…
A: (e) The value of coefficient of determination:The given data is represented in the following table:
Q: 9. From the data given below examine whether there exists any correlation between X and Y: X: 6.9…
A:
Q: 30. Calculate Karl Pearson's Coefficient of Correlation between age and playing babits tiom the data…
A:
Q: 7. Determine the coefficient of correlation for the following data. The data given relate the number…
A: Solution: 7. The correlation coefficient can be calculated by using the following formula:
Q: 9) The table below shows the cost of a hybrid car compared to its age.Construct a scatterplot for…
A: As per guidelines we will solve first question only, please repost other questions for more answers.…
Q: 2. Find the coefficient of correlation between price and sales from the foll data and interpret its…
A:
Q: Refer to Exhibit 14-2. The sample correlation coefficient equals _____. a. .9941 b. –.99705…
A: Given that X Y X \cdot YX⋅Y X^2X2 Y^2Y2 15 5 75 225 25 12 7 84 144 49 10 9 90 100…
Q: D. A study aims to determine the relationship of salt intake to the blood pressure of persons aged…
A: The random variable is systolic blood pressure. There are two independent samples which are High…
Q: The table below gives some comparative data for two dates in February of 2021. Date World Cases…
A: ANSWER
Q: The following table gives indices of industrial production of registered Calculate the value of the…
A: We have given that data. Formula used coefficients of correlation. r= SSXY /sqrt( SSXY × SSYY)
Q: 4. A college faculty collected data on his students' general weighted average in the first semester…
A:
Q: A life insurance company wishes to examine the relationship between the amount of life insurance…
A: The independent variable is INCOME. The dependent variable is INSUR. We have to find the t score…
Q: Did I answer the question #3 of my homework correctly?
A: Given a data of endotoxin levels in children as a function of their proximity to operatinf farms as…
Q: A paper gives data on x - change in Body Mass Index (BMI, in kilograms/meter) and y- change in a…
A: a) The percentage of observed variation in depression score can be explained by the simple linear…
Q: A researcher was interested in estimating the relationship between SAT scores and first year GPA. He…
A: X Y X2 Y2 XY 680 2.4 462400 5.76 1632 745 2.1 555025 4.41 1564.5 670 2.2 448900 4.84 1474…
Q: #21 The scatter plot below, shows how much money was made by an ice cream shop from selling ice…
A:
Q: Find the correlation coefficient r for the given set of data: x y 1 1 2 2 3 0 5 -6
A: x y (xi-x) (xi-x)2 (yi-y) (yi-y)2 (xi-x)(yi-y) 1 1 -1.75 3.0625 1.75 3.0625 -3.0625 2 2 -0.75…
Q: 15) The scatterplot shows the relationship between two variabl 145 12 10 8 4 0 5 10 15 20 Which…
A: Answer: -0.9
Q: We are interested in exploring the relationship between the weight of a vehicle and its fuel…
A: Part-h: Using scatter plot we can find the outlier in the above data. To draw scatter plot using…
Q: Doctors are interested in the relationship between the dosage of a medicine and the ime required for…
A: Data is given for 10 patients : Linear regression =? R^2=? F test of goodness of fit at 5%…
Q: 21. The use of Pearson's correlation analysis between the average live weight of ewes and the other…
A: Given information: Sample size=30Y=Average live weight of ewes (kg)X1=Area of grazing land…
Q: 17. A nutritionist wants to study the effect of age on muscle mass in milligrams (mg) per…
A: The given box plot represents the effect of age on muscle mass (mg/ml) for women. The population is…
Q: 4) r = 0.843, n = A) Critical values: r = +0.878, significant linear correlation B) Critical values:…
A:
Q: ratión 15.32. Calculate the rank correlation from the data given below: Sales (in lacs): Advertising…
A:
Q: ] 11. The data in the table can be entered into a calculator to determine a linear equation of best…
A: Let x represents the elapsed time in minutes y represents the depth of water in inches.
Q: 2. Two types of instruments for measuring the amount of sulfur monoxide in the atmosphere are being…
A: Solution: Given information: nA= 9 Sample size of Instrument AnB= 9 Sample size of Instrument B…
Q: 2. Two types of instruments for measuring the amount of sulfur monoxide in the atmosphere are being…
A: SOLUTION
Q: d. Monthly salary ratio e. School nominal 2. For each of the following variables, indicate whether…
A: Note: We are entitled to solve only one question at a time. As the specified one is not mentioned,…
Q: giron semEs X1 and 5. The following table gives indices of industrial production of registered…
A:
Q: 1. Test the claim that there is correlation between CPI and Cost of Pizza with a = 0.05. CPI 30.2…
A: Given Information:
Q: Let x be the age of a licensed driver in years. Let y be the percentage of all fatal accidents (for…
A: Since you have posted a question with multiple sub-parts, we will solve first three sub-parts for…
Q: is there relationship between the life expectancy for men and the life expectancy for women in a…
A: Given data represents a random sample of non -industrialized countries was selected and the life…
Q: Please answer the whole question (2) Let x be the age of a licensed driver in years. Let y be the…
A: (a) Scatter diagram of the data:The scatter diagram for the given data that is obtained using EXCEL…
Q: Please answer the whole question. (1) Let x be the age in years of a licensed automobile driver.…
A: Hello there! There are more than three sub parts in the given question. According to our policies…
Q: 7. A company wanted to assess the impact of R and D expenditure (x) on annual profit (y) following…
A: We have given that, The data swt are: X:- 9, 7, 5, 10, 4, 5, 3, 2 Y:- 45, 42, 41, 60, 30, 34, 25,…
Q: Using 5% level of significance, is there a significant relationship between hours spent studying and…
A:
Q: 14. The following table gives the miles per gallon and the load capacity for 6 SUV's. Miles per…
A: Introduction: The miles per gallon of a vehicle is a measure of its mileage, while its load capacity…
Q: In recent years there had been several studies on the effects of computer on people who spent…
A:
Q: A researcher was interested in estimating the relationship between SAT scores and first year GPA. He…
A: X Y X2 Y2 XY 680 2.4 462400 5.76 1632 745 2.1 555025 4.41 1564.5…
Q: Find Karl Pearson's coefficient of correlation between the age and the mlaying habit of the people…
A: The formula of Correlation coefficient (r) is defined by Where, A = ∑ (xi - x̄)…
Q: II. A researcher wants to know if there is a significant relationship between adolescents' 1Q and…
A: Step by step procedure for obtaining Spearman Rank Correlation coefficient using SPSS is given…
Q: 26. Find the value of mode from the data given below: Weight (kg) No. of Weight (kg.) No. of…
A:
Q: 2. Two types of instruments for measuring the amount of sulfur monoxide in the atmosphere are being…
A: Introduction: Denote σA, σB as the true population standard deviations of Instrument A and…
Q: 5. Economic growth Entrepreneurship employment No. of women entrepreneurs per 100 women 500 45 49 32…
A: "Since you have posted a question with multiple sub-parts, we will solve the first three sub-parts…
Q: aper concluded that there was a correlation between refined sugar consumption (calories per person…
A: Correlation is correct.
Q: So the value of r is highly significant. 4. Calculate the coefficient of correlation for the…
A:
Q: i 3 4 7 8. 9. 10 1 14 10 7 8. 1 12 2 Xi Yi 95 80 83 87 88 85 99 102 79 95 Molro o goottornlot of the…
A: As we are authorized to answer only 3 subparts for each question and that you haven't specified…
Q: Q1/ Showing a type of correlation and calculation factor among variables X and Y 7 11 3| 0 | 9 | 10…
A: As per our guidelines, we are allowed to answer first question only. Thanks, Please post other…
Q: When water flows across farmland, some soil is washed away, resulting in erosion. An experiment was…
A: Given: The data given is as follows Flow rate 0.31 0.85 1.26 2.47 3.75 Eroded soil 0.82 1.95…
Step by step
Solved in 2 steps with 2 images