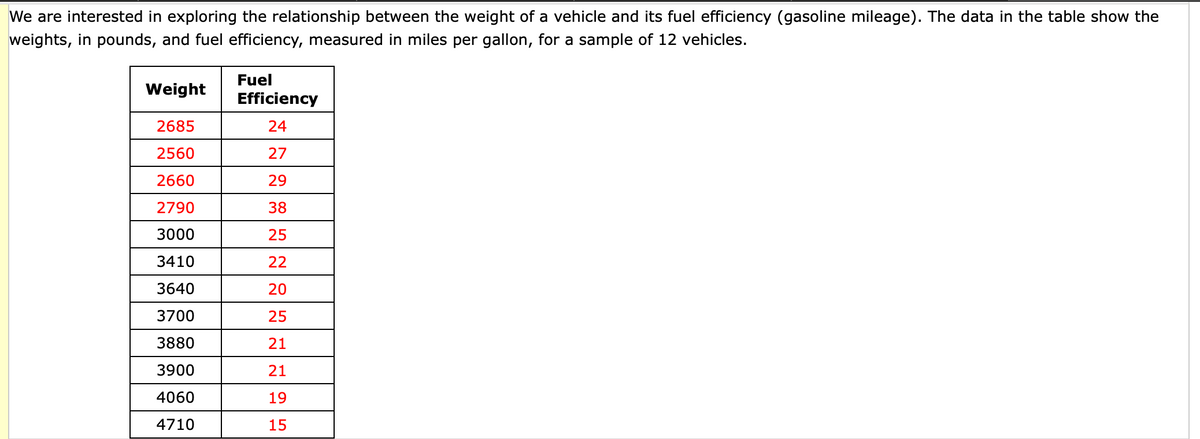
We are interested in exploring the relationship between the weight of a vehicle and its fuel efficiency (gasoline mileage). The data in the table show the weights, in pounds, and fuel efficiency, measured in miles per gallon, for a sample of 12 vehicles. Fuel Weight Efficiency 2685 24 2560 27 2660 29 2790 38 3000 25 3410 22 3640 20 3700 25 3880 21 3900 21 4060 19 4710 15


Percentage
A percentage is a number indicated as a fraction of 100. It is a dimensionless number often expressed using the symbol %.
Algebraic Expressions
In mathematics, an algebraic expression consists of constant(s), variable(s), and mathematical operators. It is made up of terms.
Numbers
Numbers are some measures used for counting. They can be compared one with another to know its position in the number line and determine which one is greater or lesser than the other.
Subtraction
Before we begin to understand the subtraction of algebraic expressions, we need to list out a few things that form the basis of algebra.
Addition
Before we begin to understand the addition of algebraic expressions, we need to list out a few things that form the basis of algebra.
Please label each part
SUBPART


Trending now
This is a popular solution!

Step by step
Solved in 3 steps with 3 images


