11. Which type of data is displayed in the table below? obene year hprice proglas surf bdrms brems 1993 85500 1600 1993 1440 1901 How 200000 was 2436 1290 1.0 22000 20 1540 20 1100 250 252 259 63000 182400 97500 57200 A 1905 1995 1905 520 1995 16 a) Cross section b) Pooled cross section. c) Panel data d) Time series data 20 2 1.5
11. Which type of data is displayed in the table below? obene year hprice proglas surf bdrms brems 1993 85500 1600 1993 1440 1901 How 200000 was 2436 1290 1.0 22000 20 1540 20 1100 250 252 259 63000 182400 97500 57200 A 1905 1995 1905 520 1995 16 a) Cross section b) Pooled cross section. c) Panel data d) Time series data 20 2 1.5

MATLAB: An Introduction with Applications
6th Edition
ISBN:9781119256830
Author:Amos Gilat
Publisher:Amos Gilat
Chapter1: Starting With Matlab
Section: Chapter Questions
Problem 1P

Related questions
Question
A2

Transcribed Image Text:11. Which type of data is displayed in the table below?
obsne
year
hprice
pregtas
sgrf
bthr
bdrs
1993
20
1993
670
140
13
20
23
200
243
4.
3.0
251
16
1250
252
1995
20
2200
4.
253
1540
20
320
1995
57200
16
a) Cross section
b) Pooled cross section
c) Panel data
d) Time series data
12. What is not an advantage of using pooled cross section as opposed to a single cross
section?
a) Standard errors will be smaller.
b) It allows us to estimate how the effect of one factor has changed over time.
c) It allows us to do first diference and fixed effects estimation.
d) It allows us to estimate time trends conditional on explanatory variables.
13. What is the IV estimator, By, in a model with the dependent variable y, the
endogenous independent variable x and the instrumental variable z? Note that no
other independent variables are included in this IV estimation.
a) By = Brs, where Br, is the estimated first stage coefficient and Bar is the
BRF
estimated reduced form coefficient.
Cov(xy)
b) Bv
Var(x)
c) Bv
Cov(zy)
%3D
Var (z)
d) By
Cov(z.y)
Cov(z,x)
%3D
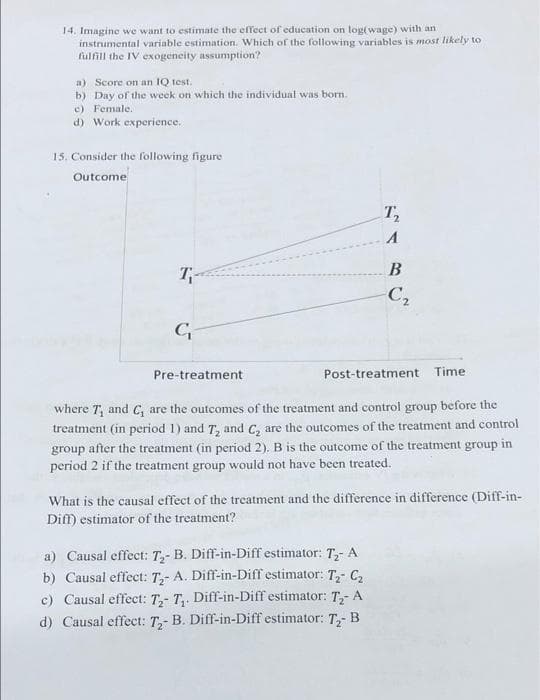
Transcribed Image Text:14. Imagine we want to estimate the effect of education on log(wage) with an
instrumental variable estimation. Which of the following variables is most likely to
fulfill the IV exogeneity assumption?
a) Score on an IQ test.
b) Day of the week on which the individual was born.
c) Female.
d) Work experience.
15. Consider the following figure
Outcome
T,
В
T;-
C2
Pre-treatment
Post-treatment Time
where T, and C, are the outcomes of the treatment and control group before the
treatment (in period 1) and T, and C, are the outcomes of the treatment and control
group after the treatment (in period 2). B is the outcome of the treatment group in
period 2 if the treatment group would not have been treated.
What is the causal effect of the treatment and the difference in difference (Diff-in-
Diff) estimator of the treatment?
a) Causal effect: T,- B. Diff-in-Diff estimator: T- A
b) Causal effect: T,- A. Diff-in-Diff estimator: T,- C,
c) Causal effect: T,- T,. Diff-in-Diff estimator: T,- A
d) Causal effect: T,- B. Diff-in-Diff estimator: T,- B
Expert Solution
This question has been solved!
Explore an expertly crafted, step-by-step solution for a thorough understanding of key concepts.

Step by step
Solved in 2 steps with 1 images

Recommended textbooks for you
MATLAB: An Introduction with Applications
Statistics
ISBN:
9781119256830
Author:
Amos Gilat
Publisher:
John Wiley & Sons Inc

Probability and Statistics for Engineering and th…
Statistics
ISBN:
9781305251809
Author:
Jay L. Devore
Publisher:
Cengage Learning

Statistics for The Behavioral Sciences (MindTap C…
Statistics
ISBN:
9781305504912
Author:
Frederick J Gravetter, Larry B. Wallnau
Publisher:
Cengage Learning
MATLAB: An Introduction with Applications
Statistics
ISBN:
9781119256830
Author:
Amos Gilat
Publisher:
John Wiley & Sons Inc
Probability and Statistics for Engineering and th…
Statistics
ISBN:
9781305251809
Author:
Jay L. Devore
Publisher:
Cengage Learning
Statistics for The Behavioral Sciences (MindTap C…
Statistics
ISBN:
9781305504912
Author:
Frederick J Gravetter, Larry B. Wallnau
Publisher:
Cengage Learning

Elementary Statistics: Picturing the World (7th E…
Statistics
ISBN:
9780134683416
Author:
Ron Larson, Betsy Farber
Publisher:
PEARSON

The Basic Practice of Statistics
Statistics
ISBN:
9781319042578
Author:
David S. Moore, William I. Notz, Michael A. Fligner
Publisher:
W. H. Freeman

Introduction to the Practice of Statistics
Statistics
ISBN:
9781319013387
Author:
David S. Moore, George P. McCabe, Bruce A. Craig
Publisher:
W. H. Freeman