12. (18 pts) In a survey of 203 professional athletes, it was found that 98 of them owned a convertible, 86 of them owned a giant screen TV, and 98 owned a sporting goods store. 25 owned a convertible and a store, 36 owned a TV and a store, and 51 owned a convertible and a TV. 15 owned all three items. a. How many athletes did not own any of the three items? 18:
12. (18 pts) In a survey of 203 professional athletes, it was found that 98 of them owned a convertible, 86 of them owned a giant screen TV, and 98 owned a sporting goods store. 25 owned a convertible and a store, 36 owned a TV and a store, and 51 owned a convertible and a TV. 15 owned all three items. a. How many athletes did not own any of the three items? 18:

Linear Algebra: A Modern Introduction
4th Edition
ISBN:9781285463247
Author:David Poole
Publisher:David Poole
Chapter2: Systems Of Linear Equations
Section2.4: Applications
Problem 2EQ: 2. Suppose that in Example 2.27, 400 units of food A, 500 units of B, and 600 units of C are placed...

Related questions
Question
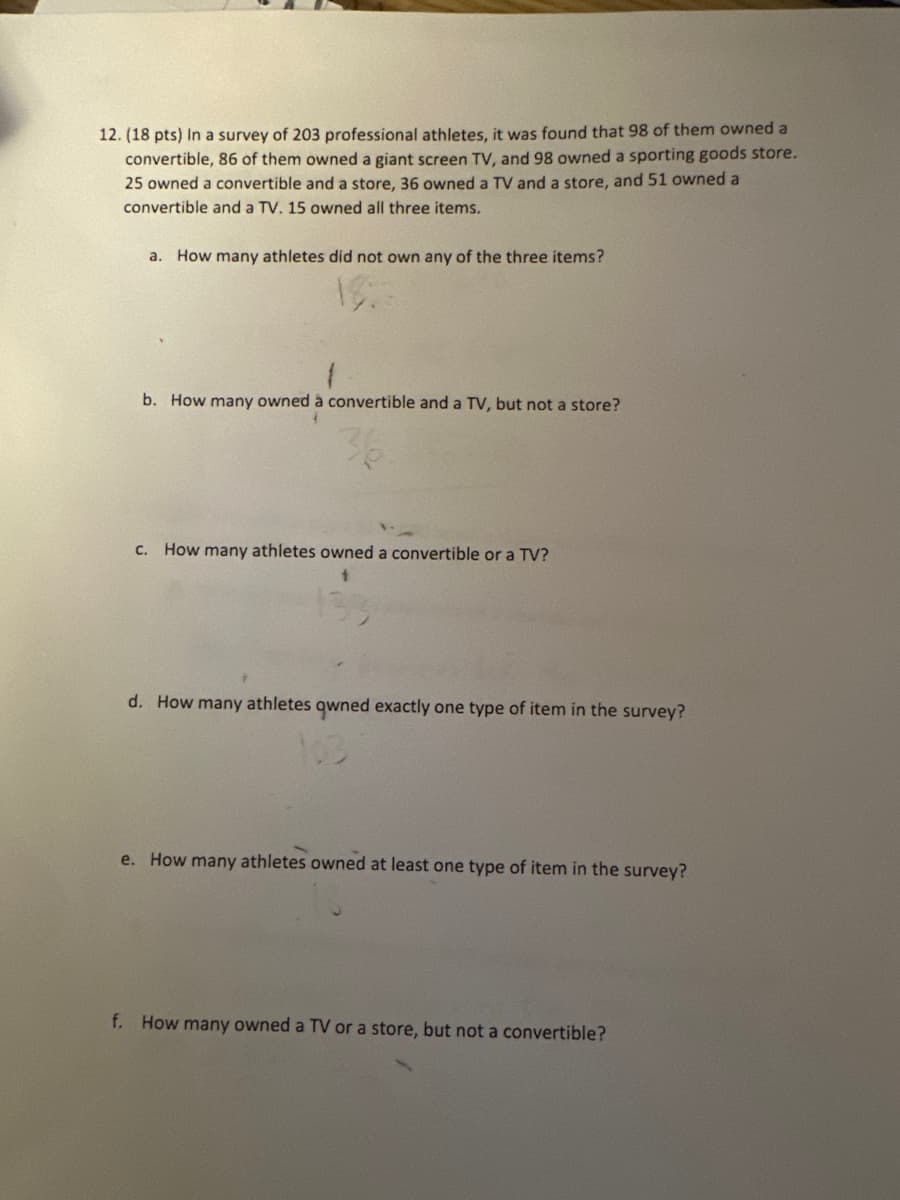
Transcribed Image Text:12. (18 pts) In a survey of 203 professional athletes, it was found that 98 of them owned a
convertible, 86 of them owned a giant screen TV, and 98 owned a sporting goods store.
25 owned a convertible and a store, 36 owned a TV and a store, and 51 owned a
convertible and a TV. 15 owned all three items.
a. How many athletes did not own any of the three items?
b. How many owned à convertible and a TV, but not a store?
36
c. How many athletes owned a convertible or a TV?
d. How many athletes owned exactly one type of item in the survey?
e. How many athletes owned at least one type of item in the survey?
f. How many owned a TV or a store, but not a convertible?
Expert Solution
This question has been solved!
Explore an expertly crafted, step-by-step solution for a thorough understanding of key concepts.

This is a popular solution!

Trending now
This is a popular solution!

Step by step
Solved in 2 steps

Recommended textbooks for you
Linear Algebra: A Modern Introduction
Algebra
ISBN:
9781285463247
Author:
David Poole
Publisher:
Cengage Learning

College Algebra
Algebra
ISBN:
9781305115545
Author:
James Stewart, Lothar Redlin, Saleem Watson
Publisher:
Cengage Learning

Algebra & Trigonometry with Analytic Geometry
Algebra
ISBN:
9781133382119
Author:
Swokowski
Publisher:
Cengage
Linear Algebra: A Modern Introduction
Algebra
ISBN:
9781285463247
Author:
David Poole
Publisher:
Cengage Learning
College Algebra
Algebra
ISBN:
9781305115545
Author:
James Stewart, Lothar Redlin, Saleem Watson
Publisher:
Cengage Learning
Algebra & Trigonometry with Analytic Geometry
Algebra
ISBN:
9781133382119
Author:
Swokowski
Publisher:
Cengage

College Algebra (MindTap Course List)
Algebra
ISBN:
9781305652231
Author:
R. David Gustafson, Jeff Hughes
Publisher:
Cengage Learning

Big Ideas Math A Bridge To Success Algebra 1: Stu…
Algebra
ISBN:
9781680331141
Author:
HOUGHTON MIFFLIN HARCOURT
Publisher:
Houghton Mifflin Harcourt