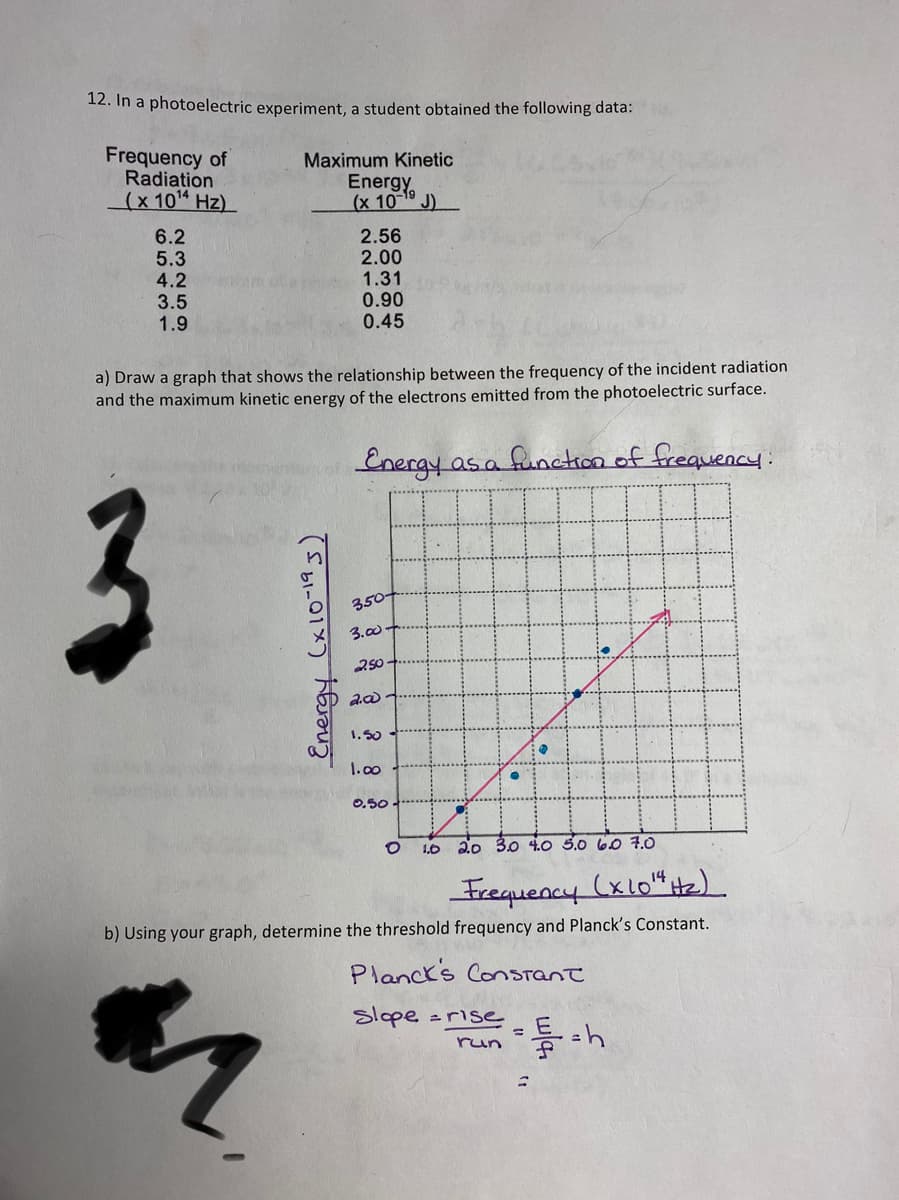
12. In a photoelectric experiment, a student obtained the following data: TT Frequency of Radiation (x10 Hz) Maximum Kinetic Energy (x 10 19 J) 6.2 5.3 4.2 3.5 1.9 2.56 2.00 1.31 0.90 0.45 a) Draw a graph that shows the relationship between the frequency of the incident radiation and the maximum kinetic energy of the electrons emitted from the photoelectric surface. Energy as a function of frequency: 3 350- 3.0- 250 1.50 I.00 రి,ఫం LO 20 30 40 5.0 60 7.0 Frequency (xlo“He) b) Using your graph, determine the threshold frequency and Planck's Constant. Planck's ConStanTt Slope =rise %3D run Energy (x10-195)


Particle Theory of Light
The particle theory of light was the proposal made by Newton in 1704 in his treatise Opticks. This is the most basic light theory, in which light is thought to be made up of microscopic particles known as "corpuscles" and that's why this particle theory of light is also named as Corpuscular theory of light.
Stopping Potential
In an experiment conducted by Heinrich Hertz, an apparatus was made where the incident light was made to fall on the metallic plate, it was discovered that metals emit electrons. The surface electrons are bound to metals with a minimum amount of energy and some of the incident photos enter the surface, they undergo collision with the atoms of the metal, they get absorbed and emit energy to an election, making it photoelectron, where the collision between the photons and electrons ejects the electrons out of the metal and with a negatively charged electron, causes photocurrent and when this current passes it creates an electric field where there is a potential difference at the output due to the anode and cathode of the electrode of the apparatus. This study involves the theory of Quantum physics and electromagnetism involving electromagnetic radiation and electromagnetic wave theory.
Quantization of Charges
An electron is a negatively charged subatomic particle either attached to an an atom or sticks to the nucleus of the atom. Electrons exert the negative charge that tries to balance the positive charge of the nucleus.

Step by step
Solved in 3 steps with 2 images


