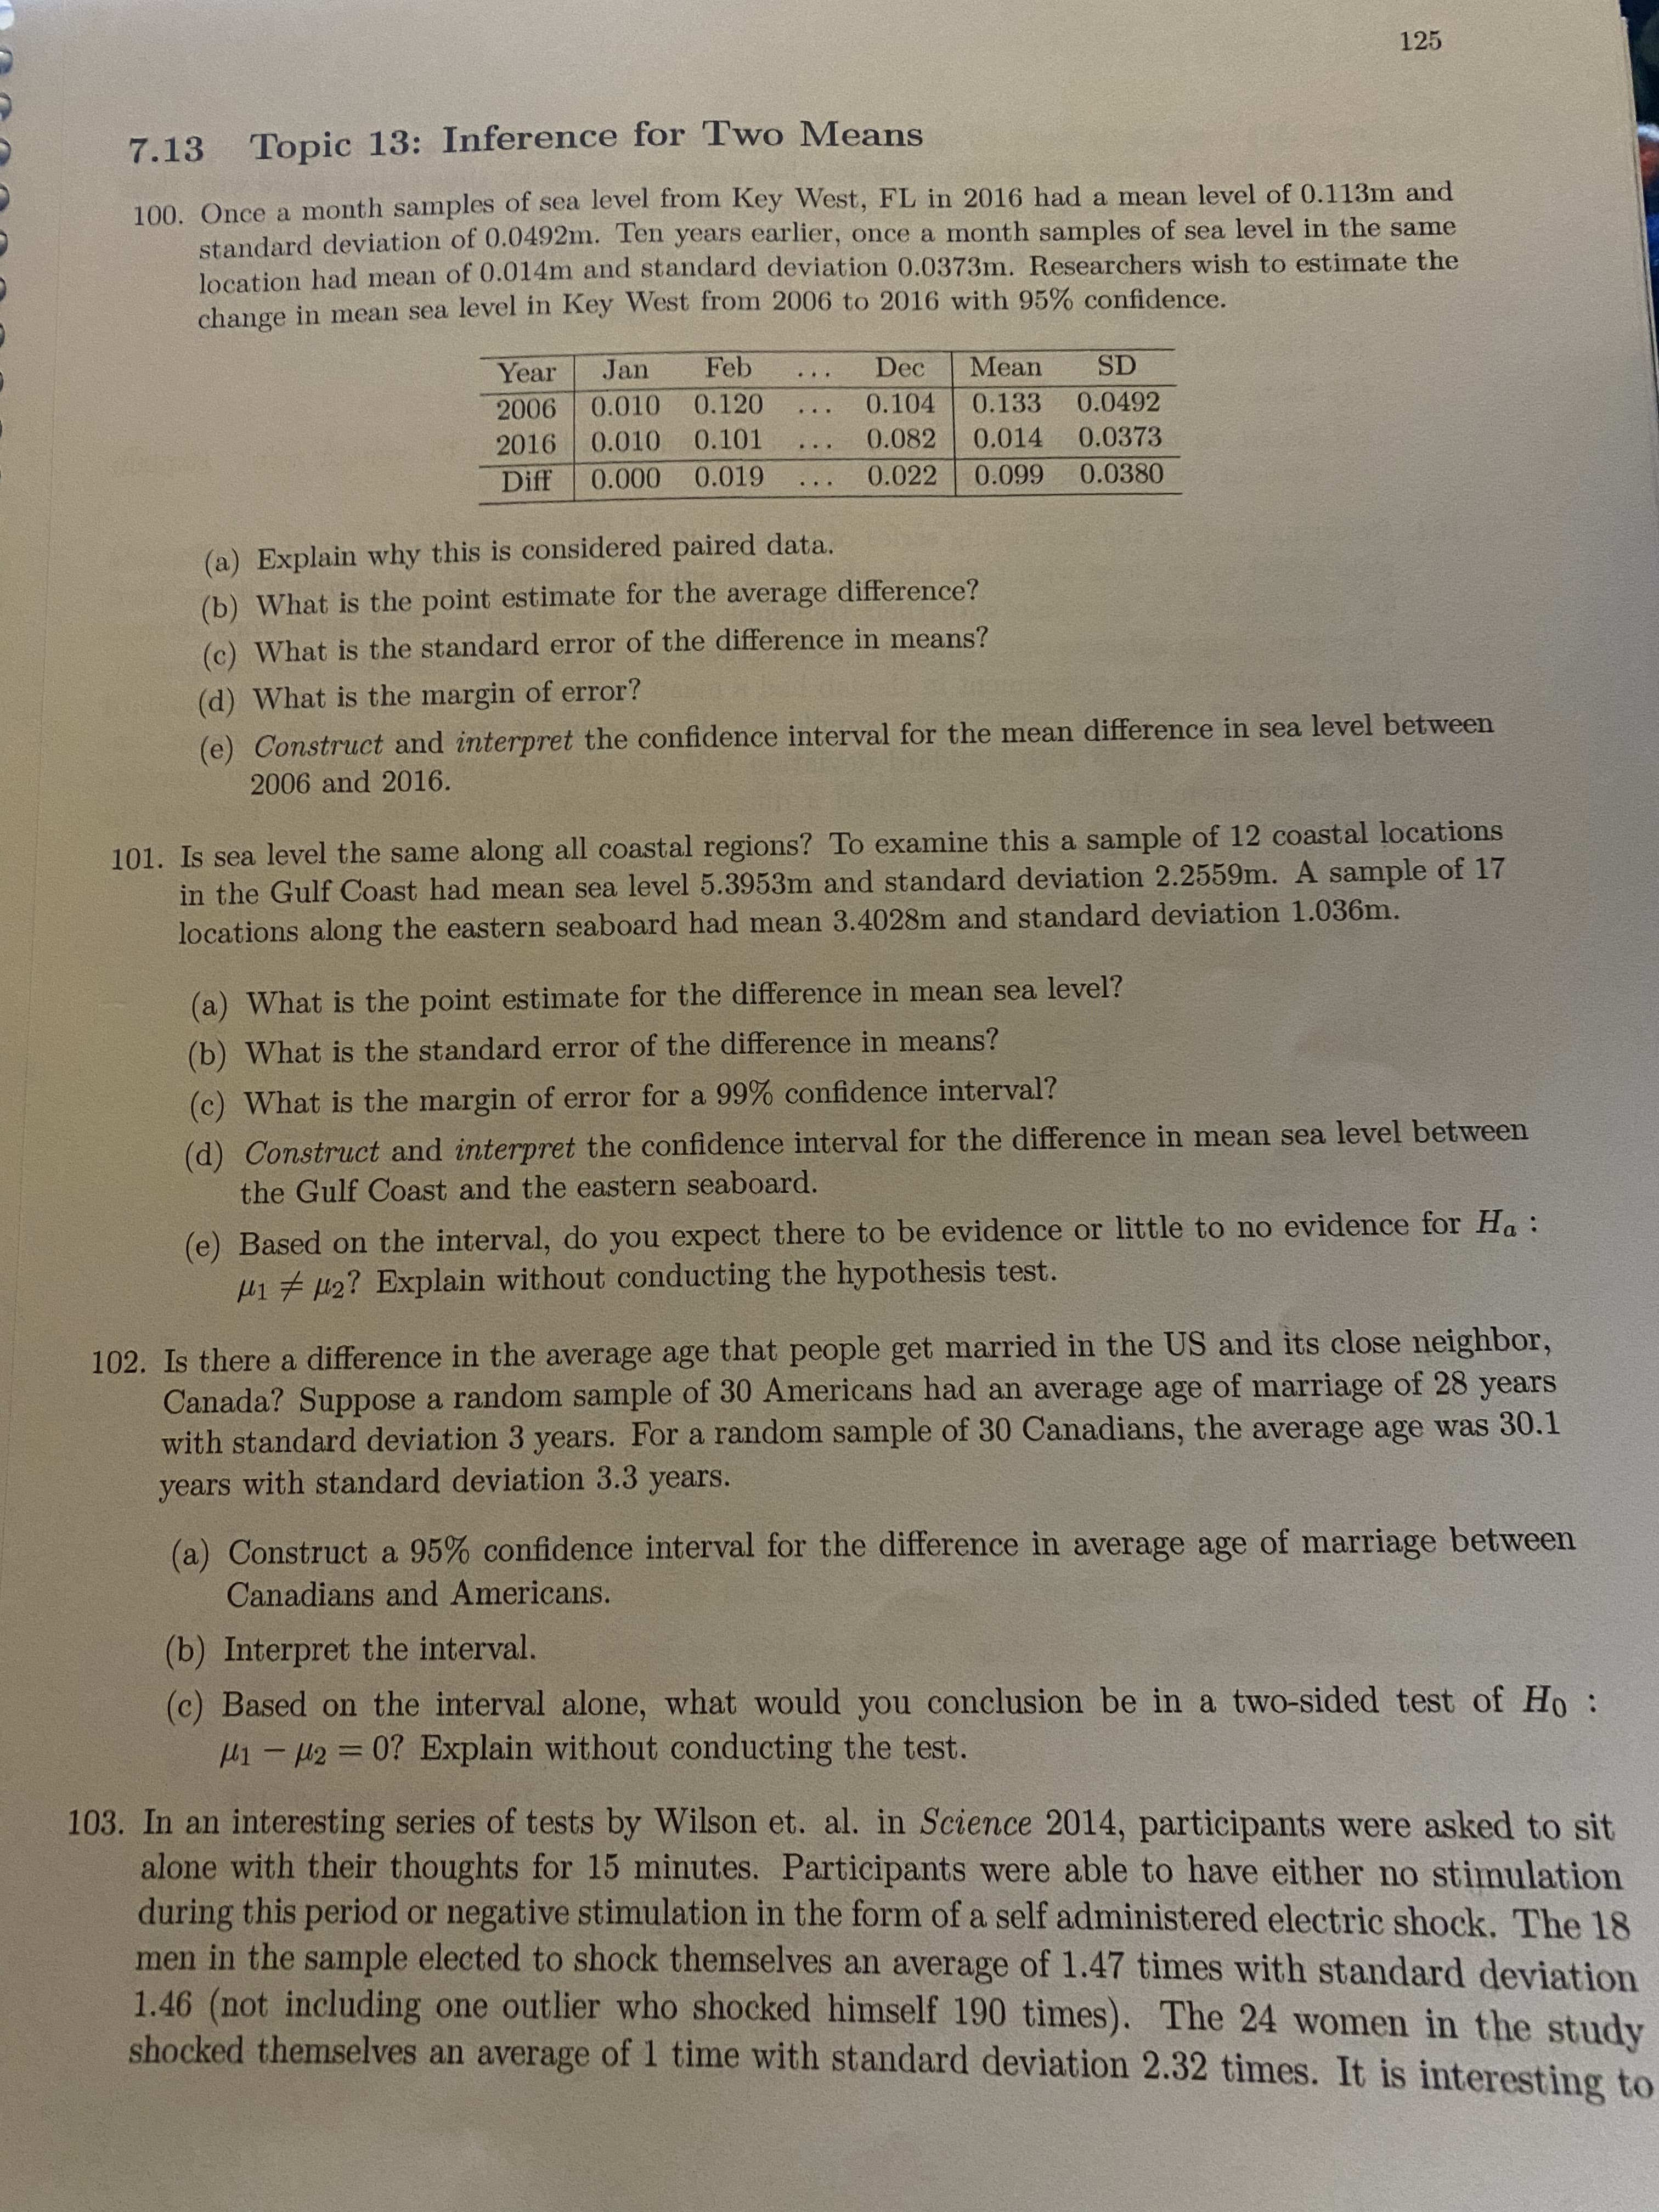
125 7.13 Topic 13: Inference for Two Means 100. Once a month samples of sea level from Key West, FL in 2016 had a mean level of 0.113m and standard deviation of 0.0492m. Ten years earlier, once a month samples of sea level in the same location had mean of 0.014m and standard deviation 0.0373m. Researchers wish to estimate the change in mean sea level in Key West from 2006 to 2016 with 95% confidence. Year Jan Feb Dec Mean SD 2006 0.010 0.120 0.104 0.133 0.0492 2016 0.010 0.101 0.082 0.014 0.0373 ... Diff 0.000 0.019 0.022 0.099 0.0380 (a) Explain why this is considered paired data. (b) What is the point estimate for the average difference? (c) What is the standard error of the difference in means? (d) What is the margin of error? (e) Construct and interpret the confidence interval for the mean difference in sea level between 2006 and 2016. 101. Is sea level the same along all coastal regions? To examine this a sample of 12 coastal locations in the Gulf Coast had mean sea level 5.3953m and standard deviation 2.2559m. A sample of 17 locations along the eastern seaboard had mean 3.4028m and standard deviation 1.036m. (a) What is the point estimate for the difference in mean sea level? (b) What is the standard error of the difference in means? (c) What is the margin of error for a 99% confidence interval? (d) Construct and interpret the confidence interval for the difference in mean sea level between the Gulf Coast and the eastern seaboard. (e) Based on the interval, do you expect there to be evidence or little to no evidence for Ha : H17 42? Explain without conducting the hypothesis test. 102. Is there a difference in the average age that people get married in the US and its close neighbor, Canada? Suppose a random sample of 30 Americans had an average age of marriage of 28 years with standard deviation 3 years. For a random sample of 30 Canadians, the average age was 30.1 years with standard deviation 3.3 years. (a) Construct a 95% confidence interval for the difference in average age of marriage between Canadians and Americans. (b) Interpret the interval. (c) Based on the interval alone, what would you conclusion be in a two-sided test of Ho: H1-2= 0? Explain without conducting the test. %3D 103. In an interesting series of tests by Wilson et. al. in Science 2014, participants were asked to sit alone with their thoughts for 15 minutes. Participants were able to have either no stimulation during this period or negative stimulation in the form of a self administered electric shock. The 18 men in the sample elected to shock themselves an average of 1.47 times with standard deviation 1.46 (not including one outlier who shocked himself 190 times). The 24 women in the study shocked themselves an average of 1 time with standard deviation 2.32 times. It is interesting to


Unitary Method
The word “unitary” comes from the word “unit”, which means a single and complete entity. In this method, we find the value of a unit product from the given number of products, and then we solve for the other number of products.
Speed, Time, and Distance
Imagine you and 3 of your friends are planning to go to the playground at 6 in the evening. Your house is one mile away from the playground and one of your friends named Jim must start at 5 pm to reach the playground by walk. The other two friends are 3 miles away.
Profit and Loss
The amount earned or lost on the sale of one or more items is referred to as the profit or loss on that item.
Units and Measurements
Measurements and comparisons are the foundation of science and engineering. We, therefore, need rules that tell us how things are measured and compared. For these measurements and comparisons, we perform certain experiments, and we will need the experiments to set up the devices.
Number 101 part A, B, and C


Trending now
This is a popular solution!

Step by step
Solved in 3 steps with 7 images


