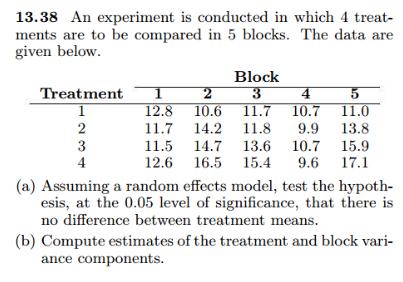
13.38 An experiment is conducted in which 4 treat- ments are to be compared in 5 blocks. The data are given below. Block 2 10.6 Treatment 3 4 1 12.8 11.7 10.7 11.0 11.7 14.2 11.8 9.9 13.8 11.5 14.7 13.6 10.7 15.9 4 12.6 16.5 15.4 9.6 17.1 (a) Assuming a random effects model, test the hypoth- esis, at the 0.05 level of significance, that there is no difference between treatment means. (b) Compute estimates of the treatment and block vari- ance components. 2 34


Q: c-2 Interpret the coefficient of determinotion. (Round your answer to one decimal place.) Sof the…
A:
Q: Study shows that teenagers spend on average $ 55.5 per month on fast food. with a standard deviation…
A: Solution-: Given: \mu=55.5, \sigma=4.5 We find, (a) P(their monthly spending is between $56.5 and…
Q: Studies suggest that women who smoke during pregnancy affect the birth weights of their newborn…
A: (c ) Use EXCEL to determine the regression equation. EXCEL procedure: Go to EXCEL Go to…
Q: Listed below are amounts of court income and salaries paid to the town justices. All amounts are in…
A: The excel output of the problem is using excel regression
Q: In a randomly selected sample of 500 registered voters in a community, 120 individuals say that they…
A: Given X=120 n=500
Q: 25 Select the correct answer from each drop-down menu. -1.8 4.8 11.4 The data represented by the…
A: Solution
Q: Suppose the probability is p = 0.4 that a person who purchases an instant lottery ticket wins money,…
A: Given that p =0.4,n=24
Q: In a mid-size company, the distribution of the number of phone calls answered each day by each of…
A:
Q: review(5a): Given the ANOVA table below ,how many groups are there? Source SS…
A: Source SS df MS Fstatistic Between 324 Within 1215 27 total…
Q: technology company is forming a task force of six members to deal with urgent quality issues. The…
A:
Q: A simple random sample of six values had mean x = 13.00 and standard deviations = 7.155. Calculate…
A: From the provided information, Sample size (n) = 6 Mean (x̄) = 13.00 Standard deviation (s) = 7.155
Q: What is the predicted explanatory value? x =
A: The regression equation is y = -1.154x - 8.512, then x = (y + 8.512)/-1.154
Q: Conduct a hypothesis test to determine if preference for paying a subscription fee to utilize the…
A:
Q: A political candidate has asked you to conduct a poll to determine what percentage of people support…
A:
Q: A regression was run to determine if there is a relationship between hours of TV watched per day (x)…
A: The independent variable is of TV watched per day. The dependent variable is number of situps a…
Q: The following table consists of the data for the 8 girls in your study. The data are sorted in order…
A: Here X-Time Spent Playing Video Games (Minutes/Day) Y -Time Spent Exercising (Minutes/Day)
Q: Use the following ANOVA table for regression to answer the questions. Analysis of Variance Source…
A:
Q: drink filling machine, when in perfect adjustment, fills the bottles with 16 ounces of soft drink. A…
A: Given that ; u = 16 Sample mean = 15.28 S = 0.24 n = 25 By using 0ne sample mean test we solve…
Q: find the 95% confidence interval to estimate the proportion of CCC g.Are we confident that the…
A: here given, Suppose that we survey a random sample of 100 adults living in Contra Costa County and…
Q: Below is the observed cell frequencies (fij) in the K × 2 table: # Successes # Failures Total Sample…
A: Solution: From the given information, the observed cell frequencies are
Q: 2. Let X,, X,.., x, be a random sample from a distribution with p.d.f. f(x;0) =0 x, T>x>0 Is the MLE…
A: Given that We have to find the MLE of theta
Q: A family wins two tickets to a concert. There are four people in the family: two parents and two…
A: Given that 4. A family wins two tickets to a concert. There are four people in the family: two…
Q: The data show the chest size and weight of several bears. Find the regression equation, letting…
A: Given Use a significance level of 0.05.
Q: According to a Gallup poll conducted in September 2016, “64.2% of U.S. adults report that they ate…
A: Solution-: Given: p^=0.642(or64.2%), n=2,415,499 adults, E=0.08 We find the 95% C.I. and What is…
Q: a.What does each line segment represent? b.Why is there a dot in the middle of each line segment?…
A: a. Each line segment represent 95% confidence interval for p. b. There is a dot in the middle of…
Q: You are conducting a test of independence for the claim that there is an association between the row…
A: Given that Contingency table. X Y Z A 20 45 41 B 30 37 42
Q: Illu.16: On 31st Lecember, 2003 Andhra Traders Lid, showed in their accountE the following balances…
A:
Q: Which types of car were driven by more than 623 respondents in the survey?
A: Here use proportion from given pie chart And calculate no of people drive that type of car
Q: Consider the probability that more than 43 out of 130 people have been in a car accident. Assume the…
A: Given that n =130 ,p =0.97
Q: Use the following ANOVA table for regression to answer the questions. Response: Y Source DF…
A: Given: Response: Y Source DF Sum Sq Mean Sq F-value Pr(>F) Regression 1 351.94 351.94 12.73…
Q: An elementary school teacher is interested in assessing how students' performance varies with the…
A: The sampling is the process that used to take sample from the population. The sampling is broadly…
Q: A survey of a class of 25 students collected data on the types of movies the students prefer most.…
A: A survey of class of 25 students collected data on the types of movies the students prefer the most.
Q: A statistics instructor claims that the mean score for all students on the first statistics exam is…
A:
Q: Suppose that in a large population of students, the mean amount of sleep the previous night was u =…
A: Note: According to Bartleby expert guidelines, we can answer only first question with their three…
Q: Here is a bivariate data set. x y 20.9 34.2 31.4 144.9 44.3 84.7 55.4 79.8 58.9 50.8 68.7…
A: Given a bivariate data set. x y 20.9 34.2 31.4 144.9 44.3 84.7 55.4 79.8 58.9 50.8…
Q: The table below describes the number of cars in stock by Motor Traders. SUV Total Compact 50…
A: a) The probability that the car is a compact car is, Pcompact car=number of compact carsTotal cars…
Q: COLUMN X COLUMN Y Q.1.1 A measure that describes a characteristic of a A. Sample population Q.1.2…
A: Given that A process in which one variable is manipulated while all other variables remain…
Q: When there is autocorrelation in time series variables, OLS regression models produce unreliable…
A: When there Is autocorrelatlon in time series variables, Ots regression models produce unreliable…
Q: The graph shows the number of errors made over time by a pianist practicing a new piece. 60 50 40 30…
A: Given problem Given that The graph shows the number of errors made over time by a pianist…
Q: Draw a frequency histogram and cumulative frequency polygon for the following distributions: a. The…
A: Given :
Q: whether the interaction will be significant. Calculate the marginal means and draw a bar graph by…
A: B1 B2 Marginal Means A1 20 40 M = 30 A2 35 25 M = 30 A3 35 25 M = 30 Marginal Means M = 30…
Q: Consider the data with analysis shown in the following computer output: Level N Mean StDev A…
A: Level N Mean StDev A 6 85.862 5.357 B 5 76.167 6.555 C 6 80.000 9.230 D 7 69.333 6.154…
Q: Heights for group of people normally distributed with mean = 65 inches and standard deviation = 2.5…
A:
Q: 1. A researcher uses a one-sample t-test to test a sample mean based on 27 scores against a…
A: As per our guidelines we can solve first multiple choice question and rest can be reposted.…
Q: poth servers are busy when yo s a single waiting line, and yo
A: Two Registers are maintained: R1 and R2 A random variable XX is said to follow an exponential…
Q: A climatologist is interested in comparing the frequency of cloud cover in Thunder Bay and Sudbury.…
A: Given that A climatologist is interested in comparing the frequency of cloud cover in Thunder Bay…
Q: assign numerical values to coin flips: Heads is +1 and Tails is –1, each with probability 1⁄2. After…
A: Given that
Q: 3) Let following be the sequence of genders of people waiting in a queue to purchase movie tickets:…
A: We are given the sequence of the gender of people as follows:- M F M F M F F F M F M F M F M M M M F…
Q: Áluminum cans contaminated by fire. A gigantic warehouse located in Tampa, Florida, stores approxi-…
A: Given that Margin of error =E =0.02 90% confidence. Sample size required.
Q: A company institutes an exercise break for workers to see if it will improve job satisfaction.…
A: here use basic of hypothesis test selection

Step by step
Solved in 8 steps with 1 images

- On snow-covered roads, winter tires enable a car to stop in a shorter distance than if summer tires were installed. In terms of the additive model for one-way ANOVA, and for an experiment in which the mean stopping distances on a snow-covered road are measured for each of four brands of winter tires. If the data are as shown in Sheet 48, what conclusion would be reached at the 0.01 level of significance? Shett 48 Supplier A 517 484 463 452 502 447 481 500 485 566 Supplier B 479 499 488 430 482 457 424 488 526 455 Supplier C 435 443 480 465 435 430 465 514 463 510 Supplier D 526 537 443 505 468 533 481 477 490 470 Select one: a) p-value = 0.28 greater than 0.05, the average distance is different for at list two tires b) F stat = 1.86, F crit = 4.38, not enough evidence to claim that the average distance is different for at list two tires c) F ratio = 4.38, not enough evidence to claim that the average distance is different for at list two tires d) F stat = 0.68, F…31% of all pygmy softshell tortoises have stripes on their shells. A herpetologist in Cititon collects a sample of 28 pygmy softshell tortoises and finds that 8 of them have stripes on their shells. Is there enough evidence to conclude, at a significance of alpha = 0.05, that the proportion of pygmy softshell tortoises in Cititon with stripes on their shells is less than 31%? What is the claim? What is the null hypothesis? What is the alternative hypothesis? What is the test statistic? What is/are the critical value(s)? Do we reject the null hypothesis? What conclusion do we draw? What is the P-value for the problem above?A travel agency is interested in finding out if different age groups frequent different Spring Break destinations, in order to better target the appropriate audiences. A random sample of college Spring Break vacationers produces the results given in the table below. Is there enough evidence at the 0.010.01 level of significance to show that there is a relationship between age (by college classification) and destination? Observed Sample of College Students Beach Mountains City Home Total Freshman 13 6 9 10 38 Sophomore 23 6 11 8 48 Junior 21 11 13 19 64 Senior 26 25 10 16 77 Total 83 48 43 53 227 Step 1 of 4: Calculate the expected value for the number of sophomores going to the mountains during Spring Break. Round your answer to six decimal places.Step 2 or 4: State the null hypothesis.Step 3 of 4: Compute the value of the test statistic. Round your answer to three decimal places, if necessary. (Note: If calculating by hand, be sure to use at least six…
- 31% of all pygmy softshell toises have stripes on their shells. A herpetologist in Cititon collects a sample of 28 pygmy softshell tortoises and finds that 8 of them have stripes on their shells. Is there enough evidence to conclude, at a significance of alpha=0.05, that the proportion of pygmy softshell tortoises in Cititon with stripes on their shells is less than 31%? What is the claim? What is the null hypothesis? What is the alternative hypothesis? What is the test statistic? What is/are the critical value(s)? Do we reject the null hypothesis? What conclusion do we draw? What is the P-value for the problem above?A travel agency is interested in finding out if different age groups frequent different Spring Break destinations, in order to better target the appropriate audiences. A random sample of college Spring Break vacationers produces the results given in the table below. Is there enough evidence at the 0.025 level of significance to show that there is a relationship between age (by college classification) and destination? Observed Sample of College Students Beach Mountains City Home Total Freshman 28 17 20 22 87 Sophomore 24 14 15 3 56 Junior 24 15 17 15 71 Senior 10 12 3 12 37 Total 86 58 55 52 251 Step 3 of 4: Compute the value of the test statistic. Round your answer to three decimal places, if necessary. (Note: If calculating by hand, be sure to use at least six decimal places in numbers for all intermediate calculations to ensure accuracy of the result.) Step 4 of 4: Draw a conclusion and interpret the decisionA random sample of Engineering and Architecture students of a university were interviewed to determine if there is an association between study habits and academic performance. The results were tabulated below. Students Favourable Neutral Unfavourable Engineering 80 60 70 Architecture 100 50 70 Test the hypothesis that there is no significant difference between the study habits and academic performance using a 0.05 level of significance.
- A sample of men and women who had passed their driver's test either the first time or the second time were surveyed, with the following results: Results of the driving testGender First time Second timeMen 126 211Women 135 178a) Do these data suggest that there is a relationship between gender and the passing of their driver’s test from which the present sample was drawn? Let alpha=.05A hospital conducted a study of the waiting time in its emergency room. The hospital has a main campus and three satellite locations. Management had a business objective of reducing waiting time for emergency room cases that did not require immediate attention. To study this, a random sample of 15 emergency room cases that did not require immediate attention at each location was selected on a particular day, and the waiting times (measured from check into when the patient was called into the clinic area) were collected and stored in the table. At the 0.05 level of significance, is there evidence of a difference in the mean waiting times in the four locations? Main Satellite 1 Satellite 2 Satellite 3 120.08 30.75 75.86 54.05 81.90 61.83 37.88 38.82 78.79 26.40 68.73 36.85 63.83 53.84 51.08 32.83 79.77 72.30 50.21 52.94 47.94 53.09 58.47 34.13 79.88 27.67 86.29 69.37 48.63 52.46 62.90 78.52 55.43 10.64 44.84 55.95 64.06 53.50 64.17 49.61 64.99 37.28 50.68…A study, which randomly surveyed 3,700 households and drew on this information from the IRS, found that 79% of households have conducted at least one IRA rollover from an employer-sponsored retirement plan. Suppose a recent random sample of 90 households in a certain county was taken and respondents were asked whether they had ever funded an IRA account with a rollover from an employer-sponsored retirement plan. Based on the sample data below, can you conclude at the 0.10 level of significance that the proportion of households in the county that have funded an IRA with a rollover is different from the proportion for all households reported in the study? 77 respondents said they had funded an account; 13 respondents said they had not
- A trucking firm is considering the installation of a new, low-restriction engine air filter for its long-haul trucks, but doesn’t want to make the switch unless the new filter can be shown to improve the fuel economy of these vehicles. A test is set up in which each of 10 trucks makes the same run twice once with the old filtration system and once with the new version. Given the sample results shown below, use the 0.05 level of significance in determining whether the new filtration system could be superior. Truck Number Current Filter (mpg) New Filter (mpg) 1 7.6 7.3 2 4.1 7.2 3 10.4 6.8 4 6.9 10.6 5 5.6 8.8 6 7.9 8.7 7 5.4 5.7 8 5.7 8.7 9 5.5 8.9 10 5.3 7.1 Do reject or fail to reject H0?A sample of 77 individuals workings at the particular office was selected and rhe noise level experienced by each individual was determined yielding the following data 55.3/55.3/55.3/55.9/55.9/55.9/55.9/56.1/56.1/. 56.1/56.1/56.1/56.1/56.8/56.8/57/57/57/57.8/57.8/57.8/57.9/57.9/57.9/58.8/58.8/58.8/59.8/59.8/. 59.8/62.2/62.2/63.8/63.8/63.8/63.9/63.9/63.9/ 64.7/64.7/64.7/65.1/65.1/65.1/65.3/65.3/65.3/. 65.3/67.4/67.4/67.4/.67.4/68.7/68.7/68.7/68.7/. 69/70.4/70.4/71.2/71.2/71.2/73/73/73.1/73.1/74.6/74.6/74.6/74.6/79.3/79.3/79.3/79.3/83/83/83 use variance techniques discussed to organize ,summarize and describe the dataWeinstein, McDermott, and Roediger (2010) report that students who were given questions to be answered while studying new material had better scores when tested on the material compared to students who were simply given an opportunity to reread the material. In a similar study, an instructor in a large psychology class gave one group of students questions to be answered while studying for the final exam. The overall average for the exam was μ = 73.4, but the n = 16 students who answered questions had a mean of M = 78.3 with a standard deviation of s = 8.4. For this study, did answering questions while studying produce significantly higher exam scores? Use a one-tailed test with α = .01 and the Distributions tool to help. (Round your answers to three decimal places, when needed.) sMM = t-critical = t = The results indicate: Failure to reject the null hypothesis; answering questions while studying did not produce significantly higher exam scores…