14. What proportion of the variation in the variable Deaths is explained by the explanatory variables Children and Income? A) 0.059 C) 0.470 B) 0.159 D) 0.941 Answer:
14. What proportion of the variation in the variable Deaths is explained by the explanatory variables Children and Income? A) 0.059 C) 0.470 B) 0.159 D) 0.941 Answer:

Glencoe Algebra 1, Student Edition, 9780079039897, 0079039898, 2018
18th Edition
ISBN:9780079039897
Author:Carter
Publisher:Carter
Chapter4: Equations Of Linear Functions
Section: Chapter Questions
Problem 8SGR

Related questions

Topic Video
Question
Hi I know that you can’t answer all questions. Can you just answer question 14 please.
Transcribed Image Text:11.
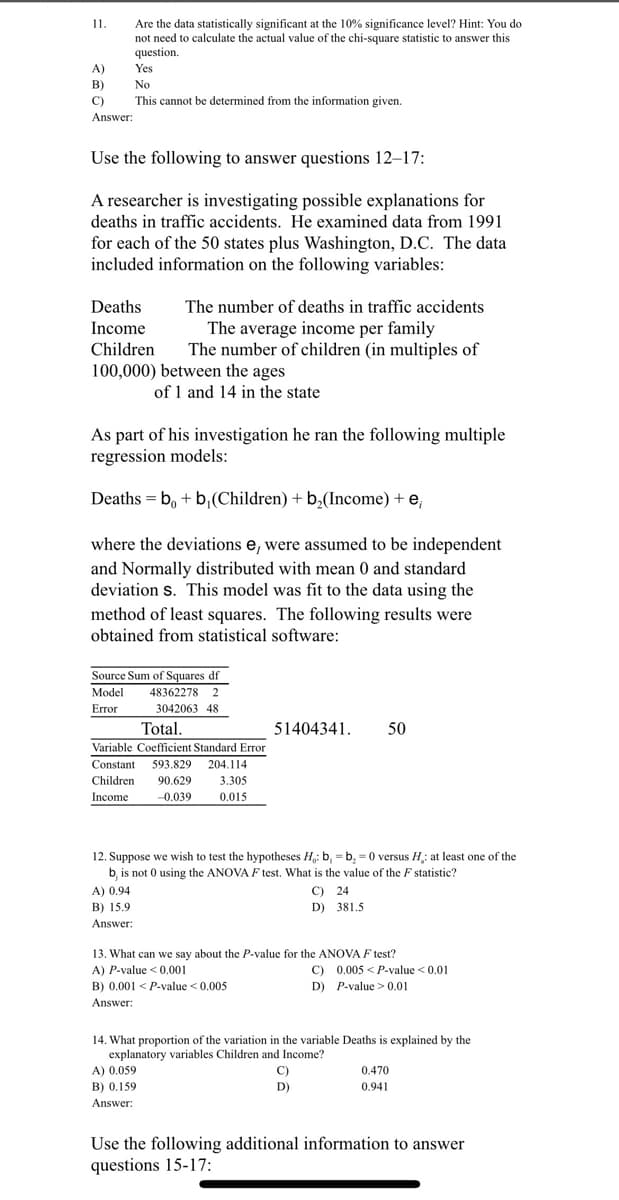
Are the data statistically significant at the 10% significance level? Hint: You do
not need to calculate the actual value of the chi-square statistic to answer this
question.
A)
Yes
B)
No
C)
This cannot be determined from the information given.
Answer:
Use the following to answer questions 12–17:
A researcher is investigating possible explanations for
deaths in traffic accidents. He examined data from 1991
for each of the 50 states plus Washington, D.C. The data
included information on the following variables:
Deaths
The number of deaths in traffic accidents
The average income per family
The number of children (in multiples of
Income
Children
100,000) between the ages
of 1 and 14 in the state
As part of his investigation he ran the following multiple
regression models:
Deaths = b, + b,(Children) + b,(Income) + e,
where the deviations e, were assumed to be independent
and Normally distributed with mean 0 and standard
deviation s. This model was fit to the data using the
method of least squares. The following results were
obtained from statistical software:
Source Sum of Squares df
Model
48362278 2
Error
3042063 48
Total.
51404341.
50
Variable Coefficient Standard Error
Constant
593.829
204.114
Children
90.629
3.305
Income
-0.039
0.015
12. Suppose we wish to test the hypotheses H,: b, = b, = 0 versus H: at least one of the
b, is not 0 using the ANOVA F test. What is the value of the F statistic?
C) 24
D) 381.5
A) 0.94
B) 15.9
Answer:
13. What can we say about the P-value for the ANOVA F test?
A) P-value < 0.001
C) 0.005 < P-value <0.01
B) 0.001 < P-value < 0.005
Answer:
D) P-value >0.01
14. What proportion of the variation in the variable Deaths is explained by the
explanatory variables Children and Income?
A) 0.059
C)
0.470
B) 0.159
D)
0.941
Answer:
Use the following additional information to answer
questions 15-17:
Expert Solution
This question has been solved!
Explore an expertly crafted, step-by-step solution for a thorough understanding of key concepts.

This is a popular solution!

Trending now
This is a popular solution!

Step by step
Solved in 2 steps with 2 images

Knowledge Booster


Learn more about
Need a deep-dive on the concept behind this application? Look no further. Learn more about this topic, statistics and related others by exploring similar questions and additional content below.Recommended textbooks for you
Glencoe Algebra 1, Student Edition, 9780079039897…
Algebra
ISBN:
9780079039897
Author:
Carter
Publisher:
McGraw Hill

College Algebra (MindTap Course List)
Algebra
ISBN:
9781305652231
Author:
R. David Gustafson, Jeff Hughes
Publisher:
Cengage Learning
Glencoe Algebra 1, Student Edition, 9780079039897…
Algebra
ISBN:
9780079039897
Author:
Carter
Publisher:
McGraw Hill
College Algebra (MindTap Course List)
Algebra
ISBN:
9781305652231
Author:
R. David Gustafson, Jeff Hughes
Publisher:
Cengage Learning