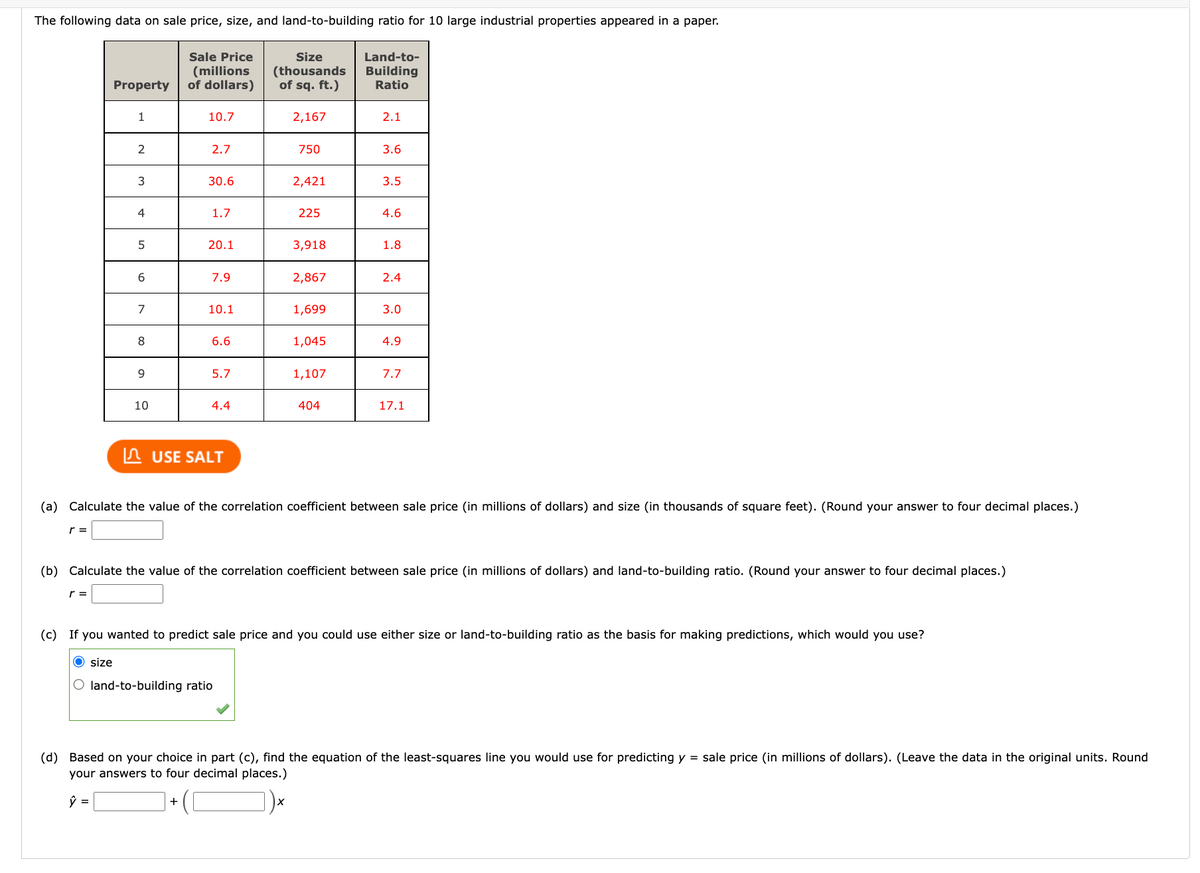
he following data on sale price, size, and land-to-building ratio for 10 large industrial properties appeared in a paper. Sale Price (millions Property of dollars) 10.7 2.7 30.6 1 2 3 4 5 1.7 20.1 Size (thousands of sq. ft.) 2,167 750 2,421 225 3,918 Land-to- Building Ratio 2.1 3.6 3.5 4.6 1.8
he following data on sale price, size, and land-to-building ratio for 10 large industrial properties appeared in a paper. Sale Price (millions Property of dollars) 10.7 2.7 30.6 1 2 3 4 5 1.7 20.1 Size (thousands of sq. ft.) 2,167 750 2,421 225 3,918 Land-to- Building Ratio 2.1 3.6 3.5 4.6 1.8

Mathematics For Machine Technology
8th Edition
ISBN:9781337798310
Author:Peterson, John.
Publisher:Peterson, John.
Chapter29: Tolerance, Clearance, And Interference
Section: Chapter Questions
Problem 16A: Spacers are manufactured to the mean dimension and tolerance shown in Figure 29-12. An inspector...

Related questions
Question
Transcribed Image Text:The following data on sale price, size, and land-to-building ratio for 10 large industrial properties appeared in a paper.
r=
Property
1
r=
2
3
4
5
6
7
8
9
10
Sale Price
(millions
of dollars)
10.7
2.7
30.6
1.7
+
20.1
7.9
10.1
6.6
5.7
4.4
USE SALT
Size
(thousands
of sq. ft.)
2,167
750
2,421
225
3,918
2,867
1,699
1,045
1,107
404
Land-to-
Building
Ratio
2.1
3.6
3.5
4.6
1.8
2.4
3.0
4.9
(a) Calculate the value of the correlation coefficient between sale price (in millions of dollars) and size (in thousands of square feet). (Round your answer to four decimal places.)
7.7
17.1
(b) Calculate the value of the correlation coefficient between sale price (in millions of dollars) and land-to-building ratio. (Round your answer to four decimal places.)
(c) If you wanted to predict sale price and you could use either size or land-to-building ratio as the basis for making predictions, which would you use?
O size
O land-to-building ratio
(d) Based on your choice in part (c), find the equation of the least-squares line you would use for predicting y = sale price (in millions of dollars). (Leave the data in the original units. Round
your answers to four decimal places.)
ŷ =
Expert Solution
This question has been solved!
Explore an expertly crafted, step-by-step solution for a thorough understanding of key concepts.

This is a popular solution!

Trending now
This is a popular solution!

Step by step
Solved in 6 steps

Recommended textbooks for you
Mathematics For Machine Technology
Advanced Math
ISBN:
9781337798310
Author:
Peterson, John.
Publisher:
Cengage Learning,
Mathematics For Machine Technology
Advanced Math
ISBN:
9781337798310
Author:
Peterson, John.
Publisher:
Cengage Learning,