15. in your treatment, compare the computed F ccmputed (Fc) value from that of Tabular value (5% and 1%), then answer the following questions: a. is the value of Computed Fc is greater than the tabular value in both 5% and 1%? (yes or no). b. is there is any significant differences among the treatment means? (yes or no). C. what is the CV value?
15. in your treatment, compare the computed F ccmputed (Fc) value from that of Tabular value (5% and 1%), then answer the following questions: a. is the value of Computed Fc is greater than the tabular value in both 5% and 1%? (yes or no). b. is there is any significant differences among the treatment means? (yes or no). C. what is the CV value?

MATLAB: An Introduction with Applications
6th Edition
ISBN:9781119256830
Author:Amos Gilat
Publisher:Amos Gilat
Chapter1: Starting With Matlab
Section: Chapter Questions
Problem 1P

Related questions
Question
Hi tutors, Pls help me. Can you answer this Question Number 15. I really need it Today cuz, I have to passed it tomorrow morning. Plssssssss. Thank u
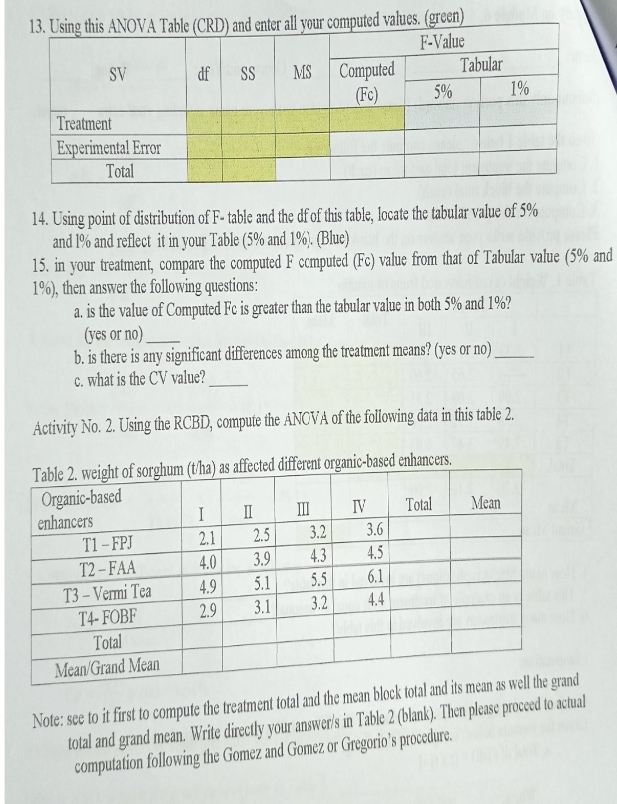
Transcribed Image Text:13. Using this ANOVA Table (CRD) and enter all your computed values. (green)
F-Value
Tabular
1%
SV
df
Computed
(Fc)
SS
MS
5%
Treatment
Experimental Error
Total
14. Using point of distribution of F- table and the df of this table, locate the tabular value of 5%
and 1% and reflect it in your Table (5% and 1%). (Blue)
15. in your treatment, compare the computed F ccmputed (Fc) value from that of Tabular value (5% and
1%), then answer the following questions:
a. is the value of Computed Fc is greater than the tabular value in both 5% and 1%?
(yes or no).
b. is there is any significant differences among the treatment means? (yes or no)
C. what is the CV value?
Áctivity No. 2. Using the RCBD, compute the ANCVA of the following data in this table 2.
Table 2. weight of sorghum (t'ha) as affected different organic-based enhancers.
Organic-based
enhancers
I
II
II
IV
Total
Mean
T1 -FPJ
2.1
2.5
3.2
3.6
T2 – FAA
4.0
3.9
4.3
4.5
4.9
5.1
5.5
6.1
T3 - Vermi Tea
T4- FOBF
Total
2.9
3.1
3.2
4.4
Mean/Grand Mean
Note: see to it first to compute the treatment total and the mean block total and its mean as well the grand
total and grand mean. Write directly your answer/s in Table 2 (blank). Then please proceed to actual
computation following the Gomez and Gomez or Gregorio's procedure.
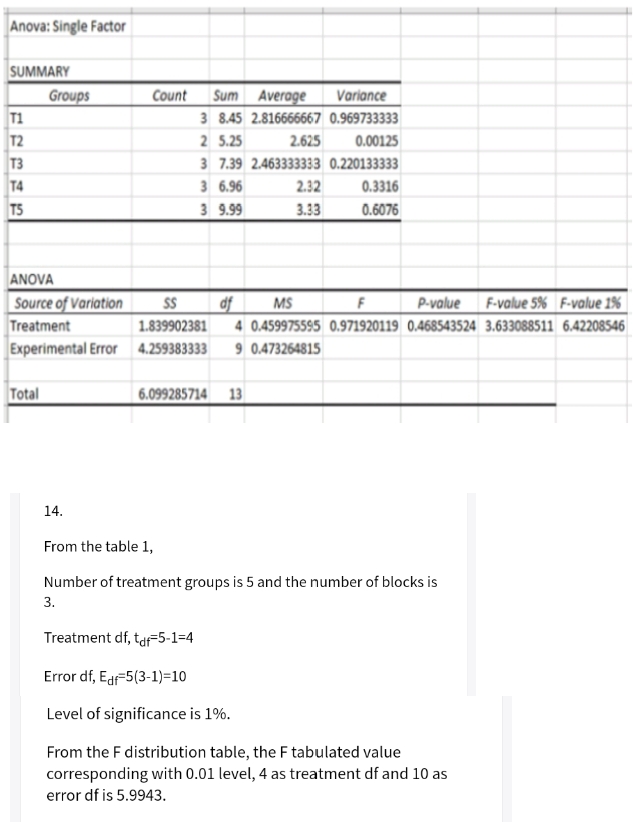
Transcribed Image Text:Anova: Single Factor
SUMMARY
Sum Average
3 8.45 2.816666667 0.969733333
2 5.25
Groups
Count
Variance
T1
T2
T3
2.625
0.00125
3 7.39 2.463333333 0.220133333
3 6.96
3 9.99
T4
2.32
0.3316
T5
3.33
0.6076
ANOVA
Source of Variation
Treatment
Experimental Error 4.259383333
SS
df
MS
P-value
F-value 5% F-value 1%
1.839902381
4 0.459975595 0.971920119 0.468543524 3.633088511 6.42208546|
9 0.473264815
Total
| 6.099285714 13
14.
From the table 1,
Number of treatment groups is 5 and the number of blocks is
3.
Treatment df, taf=5-1=4
Error df, Edf-5(3-1)=10
Level of significance is 1%.
From the F distribution table, the F tabulated value
corresponding with 0.01 level, 4 as treatment df and 10 as
error df is 5.9943.
Expert Solution
This question has been solved!
Explore an expertly crafted, step-by-step solution for a thorough understanding of key concepts.

Step by step
Solved in 3 steps

Recommended textbooks for you
MATLAB: An Introduction with Applications
Statistics
ISBN:
9781119256830
Author:
Amos Gilat
Publisher:
John Wiley & Sons Inc

Probability and Statistics for Engineering and th…
Statistics
ISBN:
9781305251809
Author:
Jay L. Devore
Publisher:
Cengage Learning

Statistics for The Behavioral Sciences (MindTap C…
Statistics
ISBN:
9781305504912
Author:
Frederick J Gravetter, Larry B. Wallnau
Publisher:
Cengage Learning
MATLAB: An Introduction with Applications
Statistics
ISBN:
9781119256830
Author:
Amos Gilat
Publisher:
John Wiley & Sons Inc
Probability and Statistics for Engineering and th…
Statistics
ISBN:
9781305251809
Author:
Jay L. Devore
Publisher:
Cengage Learning
Statistics for The Behavioral Sciences (MindTap C…
Statistics
ISBN:
9781305504912
Author:
Frederick J Gravetter, Larry B. Wallnau
Publisher:
Cengage Learning

Elementary Statistics: Picturing the World (7th E…
Statistics
ISBN:
9780134683416
Author:
Ron Larson, Betsy Farber
Publisher:
PEARSON

The Basic Practice of Statistics
Statistics
ISBN:
9781319042578
Author:
David S. Moore, William I. Notz, Michael A. Fligner
Publisher:
W. H. Freeman

Introduction to the Practice of Statistics
Statistics
ISBN:
9781319013387
Author:
David S. Moore, George P. McCabe, Bruce A. Craig
Publisher:
W. H. Freeman