16 and less than 20 (i) Calculate the mean and standard deviation for the above data.

Glencoe Algebra 1, Student Edition, 9780079039897, 0079039898, 2018
18th Edition
ISBN:9780079039897
Author:Carter
Publisher:Carter
Chapter10: Statistics
Section10.4: Distributions Of Data
Problem 19PFA

Related questions
Question
100%
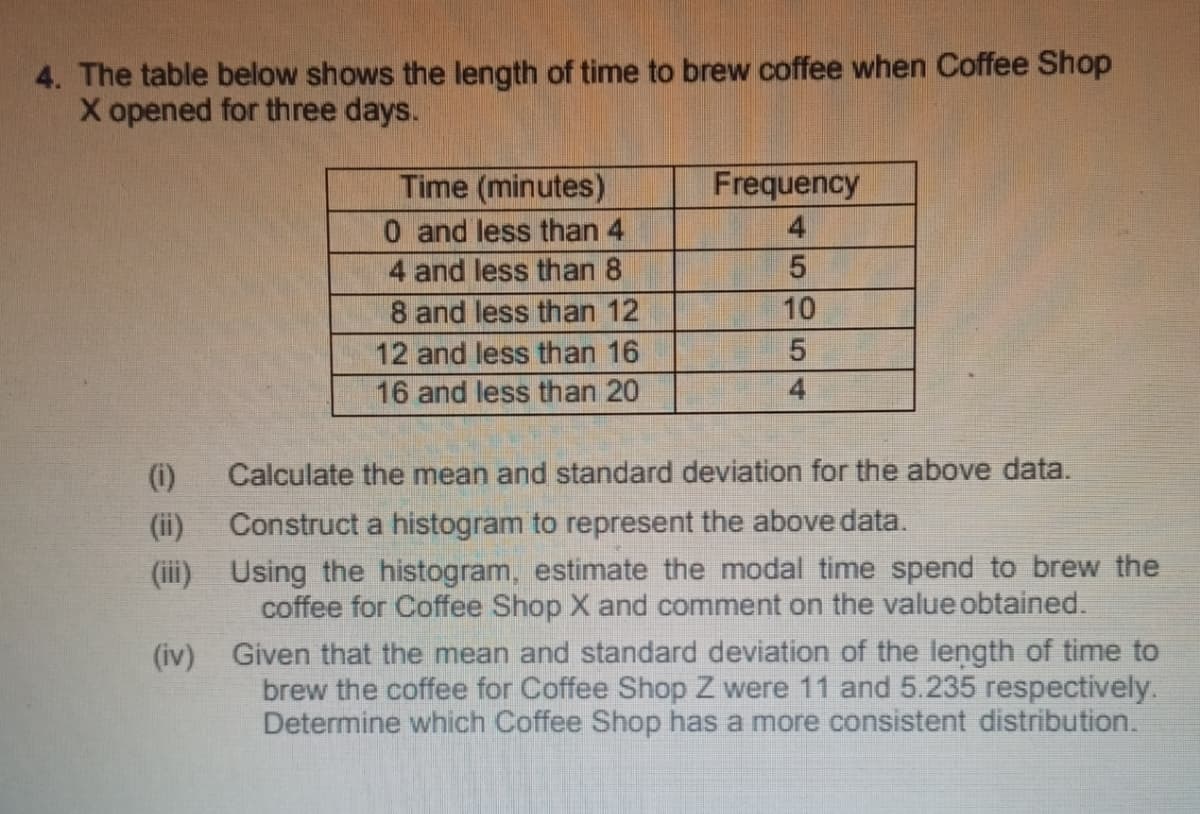
Transcribed Image Text:4. The table below shows the length of time to brew coffee when Coffee Shop
X opened for three days.
Time (minutes)
0 and less than 4
4 and less than 8
Frequency
4
8 and less than 12
10
12 and less than 16
16 and less than 20
4.
(i)
Calculate the mean and standard deviation for the above data.
Construct a histogram to represent the above data.
Using the histogram, estimate the modal time spend to brew the
coffee for Coffee Shop X and comment on the value obtained.
Given that the mean and standard deviation of the length of time to
brew the coffee for Coffee Shop Z were 11 and 5.235 respectively.
Determine which Coffee Shop has a more consistent distribution.
(ii)
(ii)
(iv)
Expert Solution
This question has been solved!
Explore an expertly crafted, step-by-step solution for a thorough understanding of key concepts.

This is a popular solution!

Trending now
This is a popular solution!

Step by step
Solved in 2 steps

Recommended textbooks for you
Glencoe Algebra 1, Student Edition, 9780079039897…
Algebra
ISBN:
9780079039897
Author:
Carter
Publisher:
McGraw Hill
Glencoe Algebra 1, Student Edition, 9780079039897…
Algebra
ISBN:
9780079039897
Author:
Carter
Publisher:
McGraw Hill