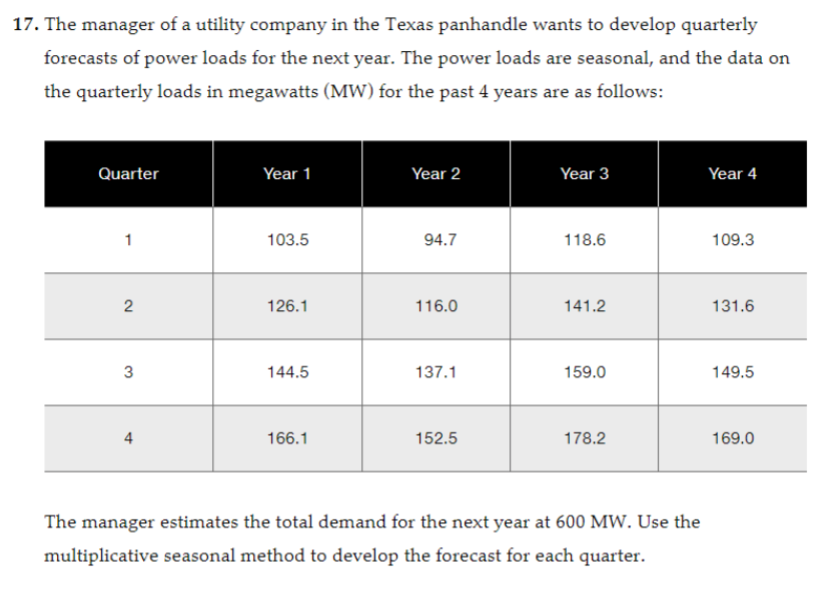
17. The manager of a utility company in the Texas panhandle wants to develop quarterly forecasts of power loads for the next year. The power loads are seasonal, and the data on the quarterly loads in megawatts (MW) for the past 4 years are as follows: Quarter 1 2 3 4 Year 1 103.5 126.1 144.5 166.1 Year 2 94.7 116.0 137.1 152.5 Year 3 118.6 141.2 159.0 178.2 The manager estimates the total demand for the next year at 600 MW. Use the multiplicative seasonal method to develop the forecast for each quarter. Year 4 109.3 131.6 149.5 169.0


Q: The university administration would like to add some additional parking locations. To make everyone…
A: With the given LPP, and the six variables, formulating in excel: Formulae: Solver constraints:
Q: A contractor, Susan Meyer, has to haul gravel to three building sites. She can purchase as much as…
A: Objective functions and constraints: Objective functions: Minimize C = (100+300) X11…
Q: Given the following product structure, master production schedule, and inventory status below and…
A: Given information is Period 8 9 10 11 12 Gross req of A 100 60 160 Gross req of H 90…
Q: Fearless Inc. has designed and tested 400 Super Sucker Vacuum Cleaner models. All of them were…
A: Total working time =400*1000 = 400000 Total breakdown time = 900+500 =1400 Total breakdown incidence…
Q: 1.Lucy is in charge of planning and coordinating a project. Following the activity information for…
A: Given data is
Q: a. Maximize z = 66x₁ - 22x2 Subject to Primal -X1 + x₂ 0 Pr
A: Linear programming is a mathematical technique that is also used in operations management…
Q: In a BIP problem with 3 mutually exclusive alternatives, x₁, x2, and x3, the following constraint…
A: Linear programming is a mathematical technique that is also used in operations management…
Q: Given forecast errors of -5, -10, and +15, the MSE is: O 116.67 O 900 0 O 175 350
A: Find the Calculation methods below: MSE = Average of Error2Error2 = Forecast Error * Forecast Error…
Q: William Beville's computer training school, in Richmond, stocks workbooks with the following…
A: For the workbooks, Demand = D = 19400 units per year Ordering Cost = $ 27 per order Holding Cost =…
Q: Gerald Glynn manages the Michaels Distribution Center. After careful examination of his database…
A: Workforce scheduling is a part of capacity management in the organizations where customer arrival…
Q: 3) What are the key traits and differences of Project and Review Technique (PERT)/Critical Path…
A: In a project, scheduling activities is important in order to complete the project within the scope…
Q: How strategic management helps an organisation in the achievement of Organisational objectives ?
A: The proper management of a company's resources is essential to achieving its goals and objectives.…
Q: The demand for subassembly S is 100 units in week 7. Each unit of S requires 1 unit of T and 2 units…
A: The product structure - shows or describes how all the components of the product fit concurrently…
Q: Doña Blanca plans to open a small car wash and must decide how much space to allocate to waiting…
A: The given question is based on finite queue variation of M/M/s model which is M/M/s/K where K…
Q: Determination of the reorder point?
A: Reorder points are essential for any company that wishes to manage its inventory effectively. Making…
Q: QUESTION #4 Four delivery trucks are in a queue at a Tool Company with only one service bay. The…
A: Given data is
Q: For the data set Download data set, perform exponential smoothing with alpha = 0.1 to determine the…
A: Given the data stated below, for this dataset, I would perform the exponential smoothing forecast,…
Q: Use the following dummy variables to develop an estimated regression equation to account for…
A: "Since you have asked multiple question, we will solve the first question for you. If you want any…
Q: The 4M company has a lathe as the centerpiece of the plant's work. The jobs arrive according to a…
A: Given data: Arrival rate (λ) = 2 per day Service rate (μ) = 4 per day Utilization λμ =24= 0.5
Q: State the value that the operations manager would add in an organization
A: Operation manager - The role of operation manager is to manage all the activities which involves…
Q: When Mikayla decided to open a café, she had to decide how much seating she should have in her café…
A: Creating a strategy for designing and manufacturing a particular good or service is known as…
Q: The figure below shows the possible routes from city A to city J as well as the time (in minutes)…
A: Compute the minimum time taken by formulating a spreadsheet as shown below:
Q: Find the shortest-route distance from Chicago to node 6.
A: Operation management is performed in each manufacturing organization. It all deals with the…
Q: Consider the primal problem below. The application of the simplex method to the primal requires the…
A: Linear programming is a mathematical technique that is also used in operations management…
Q: Blair & Rosen, Inc. (B&R), is a brokerage firm that specializes in investment portfolios designed to…
A:
Q: Stanford Rosenberg Computing wants to establish an assembly line for producing a new product, the…
A: Find the Calculation methods below: Cycle Time = Available TimeDemand
Q: (A) if the profit on a trick ski is $60 and the profit on a slalom ski is $50, how many of each type…
A: Linear programming is a mathematical technique that is also used in operations management…
Q: Projects are scarce in todays business. explain where projects come from and what can be done to…
A: Every project, in essence, begins with a concept. The concept is frequently one of how to carry out…
Q: Using an R Chart, what are the upper and lower control limits?
A: Given Mean = 99.73% Z-score corresponding to 99.73%, under normal distribution = 3 Standard…
Q: Forecast accuracy is important because it impacts the organizations' money and people. True False
A: Accurate forecasting helps with cost cutting, production and staff scheduling, capital planning and…
Q: In an M/M/1 queueing system, the arrival rate is 5 customers per hour and the service rate is 7…
A: Given data: Customer Arrival rate λ= 5 customers per hour Customer Service rate μ = 7 customers per…
Q: Explain why determining the “right quality” is important for the purchasing and supply function in a…
A: Here, the case states that after a fruitful test, the business accepted a new approach that…
Q: (a) Reformulate this problem as a general linear programming problem, and then solve it manually by…
A: The transportation model is used to calculate the minimum cost of the route by selecting different…
Q: c. Maximize z = X₁ + X2 Subject to Primal 2x1 + x₂ = 5 3x1 - x₂ = 6 X₁, X2 unrestricted Primal in…
A: Dual is a the linear program which convert primal program into dual program. In the dual program,…
Q: Activity A can start as soon as the project starts, and set the earliest start time for activity an…
A: Given: Duration of activity A (D) = 5 Early start of activity A (ES) = 0
Q: Expected Time fot the critical path on a PERT network is 18.2 weeks, and the critical path variance…
A: Find the Calculation methods below: Probability = Projected time - Actual durationStandard…
Q: Operations management is a process that uses resources to transform inputs into outputs. Explain the…
A: Operations is a very important part of any business. It consists of all the activities related to…
Q: Question 7 options: You would like to develop variable control chart with three-sigma control…
A: Given data: The no. of samples = 10 No. of observation = 20
Q: What is the average number of boats that will be waiting for service? (c) What is the average time…
A: Queuing theory is the study of waiting for lines/queues. This model helps to determine the length…
Q: a) How many tires should Rocky Mountain order each time it places an order? Rocky Mountain's optimal…
A: EOQ = √(2DS/H) Annual Holding cost = (Q*H)/2 Annual Setup cost = (D*S)/Q Annual purchase cost =…
Q: Use the following payoff table to complete parts (a) through (j). The probability of event 1 is…
A: Decision-making is influenced by an organization as per the degree of certainty involved in this. In…
Q: What is the probability of completing in 21 weeks?
A: A network diagram related to the project shows the sequence of the task that is performed to…
Q: ment strategy is irrelevant because market forces will always dictate where the balance of power is…
A: The phrase "procurement strategy" describes a long-term plan to forge strategic ties with rival…
Q: A company trades with a number of items and the management is interested in classifying the items…
A: Find the Calculation methods below: Step 1: Find annual usage: (Annual demand * Unitary cost) Step…
Q: nventory Models that reorder items to a certain number of units : Fixed-time period model…
A: Ans) Inventory is very important to any business. It helps in protecting the firm from sudden jump…
Q: give the Social Constraint in construction hospital project
A: For this project management question, the example project is a Hospital construction project, For…
Q: Instructions There are four parts to this problem. Use Excel to perform the following. a. Use the…
A: using the same formula for EOQ as instructed. a.
Q: Operations management is a process that uses resources to transform inputs into outputs. Explain the…
A: Operations is a very important part of any business. It consists of all the activities related to…
Q: Product A is an end item and is made from two units of B and four of C. B is made of three units of…
A: Ans) Product Tree:
Q: Pls send me solution fast within 10 min and i will rate instantly for sure!! Solution must be in…
A: Given Demand = -1.5 * price + 25 Unit cost of A = Rs 3 1 A = 20 B Profit per unit of B =…


Trending now
This is a popular solution!

Step by step
Solved in 3 steps

- In Example 11.1, the possible profits vary from negative to positive for each of the 10 possible bids examined. a. For each of these, use @RISKs RISKTARGET function to find the probability that Millers profit is positive. Do you believe these results should have any bearing on Millers choice of bid? b. Use @RISKs RISKPERCENTILE function to find the 10th percentile for each of these bids. Can you explain why the percentiles have the values you obtain?An automobile manufacturer is considering whether to introduce a new model called the Racer. The profitability of the Racer depends on the following factors: The fixed cost of developing the Racer is triangularly distributed with parameters 3, 4, and 5, all in billions. Year 1 sales are normally distributed with mean 200,000 and standard deviation 50,000. Year 2 sales are normally distributed with mean equal to actual year 1 sales and standard deviation 50,000. Year 3 sales are normally distributed with mean equal to actual year 2 sales and standard deviation 50,000. The selling price in year 1 is 25,000. The year 2 selling price will be 1.05[year 1 price + 50 (% diff1)] where % diff1 is the number of percentage points by which actual year 1 sales differ from expected year 1 sales. The 1.05 factor accounts for inflation. For example, if the year 1 sales figure is 180,000, which is 10 percentage points below the expected year 1 sales, then the year 2 price will be 1.05[25,000 + 50( 10)] = 25,725. Similarly, the year 3 price will be 1.05[year 2 price + 50(% diff2)] where % diff2 is the percentage by which actual year 2 sales differ from expected year 2 sales. The variable cost in year 1 is triangularly distributed with parameters 10,000, 12,000, and 15,000, and it is assumed to increase by 5% each year. Your goal is to estimate the NPV of the new car during its first three years. Assume that the company is able to produce exactly as many cars as it can sell. Also, assume that cash flows are discounted at 10%. Simulate 1000 trials to estimate the mean and standard deviation of the NPV for the first three years of sales. Also, determine an interval such that you are 95% certain that the NPV of the Racer during its first three years of operation will be within this interval.Suppose that a regional express delivery service company wants to estimate the cost of shipping a package (Y) as a function of cargo type, where cargo type includes the following possibilities: fragile, semifragile, and durable. Costs for 15 randomly chosen packages of approximately the same weight and same distance shipped, but of different cargo types, are provided in the file P13_16.xlsx. a. Estimate a regression equation using the given sample data, and interpret the estimated regression coefficients. b. According to the estimated regression equation, which cargo type is the most costly to ship? Which cargo type is the least costly to ship? c. How well does the estimated equation fit the given sample data? How might the fit be improved? d. Given the estimated regression equation, predict the cost of shipping a package with semifragile cargo.
- A company manufacturers a product in the United States and sells it in England. The unit cost of manufacturing is 50. The current exchange rate (dollars per pound) is 1.221. The demand function, which indicates how many units the company can sell in England as a function of price (in pounds) is of the power type, with constant 27556759 and exponent 2.4. a. Develop a model for the companys profit (in dollars) as a function of the price it charges (in pounds). Then use a data table to find the profit-maximizing price to the nearest pound. b. If the exchange rate varies from its current value, does the profit-maximizing price increase or decrease? Does the maximum profit increase or decrease?Based on Babich (1992). Suppose that each week each of 300 families buys a gallon of orange juice from company A, B, or C. Let pA denote the probability that a gallon produced by company A is of unsatisfactory quality, and define pB and pC similarly for companies B and C. If the last gallon of juice purchased by a family is satisfactory, the next week they will purchase a gallon of juice from the same company. If the last gallon of juice purchased by a family is not satisfactory, the family will purchase a gallon from a competitor. Consider a week in which A families have purchased juice A, B families have purchased juice B, and C families have purchased juice C. Assume that families that switch brands during a period are allocated to the remaining brands in a manner that is proportional to the current market shares of the other brands. For example, if a customer switches from brand A, there is probability B/(B + C) that he will switch to brand B and probability C/(B + C) that he will switch to brand C. Suppose that the market is currently divided equally: 10,000 families for each of the three brands. a. After a year, what will the market share for each firm be? Assume pA = 0.10, pB = 0.15, and pC = 0.20. (Hint: You will need to use the RISKBINOMLAL function to see how many people switch from A and then use the RISKBENOMIAL function again to see how many switch from A to B and from A to C. However, if your model requires more RISKBINOMIAL functions than the number allowed in the academic version of @RISK, remember that you can instead use the BENOM.INV (or the old CRITBENOM) function to generate binomially distributed random numbers. This takes the form =BINOM.INV (ntrials, psuccess, RAND()).) b. Suppose a 1% increase in market share is worth 10,000 per week to company A. Company A believes that for a cost of 1 million per year it can cut the percentage of unsatisfactory juice cartons in half. Is this worthwhile? (Use the same values of pA, pB, and pC as in part a.)Suppose you have invested 25% of your portfolio in four different stocks. The mean and standard deviation of the annual return on each stock are shown in the file P11_46.xlsx. The correlations between the annual returns on the four stocks are also shown in this file. a. What is the probability that your portfolios annual return will exceed 30%? b. What is the probability that your portfolio will lose money during the year?
- The annual demand for Prizdol, a prescription drug manufactured and marketed by the NuFeel Company, is normally distributed with mean 50,000 and standard deviation 12,000. Assume that demand during each of the next 10 years is an independent random number from this distribution. NuFeel needs to determine how large a Prizdol plant to build to maximize its expected profit over the next 10 years. If the company builds a plant that can produce x units of Prizdol per year, it will cost 16 for each of these x units. NuFeel will produce only the amount demanded each year, and each unit of Prizdol produced will sell for 3.70. Each unit of Prizdol produced incurs a variable production cost of 0.20. It costs 0.40 per year to operate a unit of capacity. a. Among the capacity levels of 30,000, 35,000, 40,000, 45,000, 50,000, 55,000, and 60,000 units per year, which level maximizes expected profit? Use simulation to answer this question. b. Using the capacity from your answer to part a, NuFeel can be 95% certain that actual profit for the 10-year period will be between what two values?Although the normal distribution is a reasonable input distribution in many situations, it does have two potential drawbacks: (1) it allows negative values, even though they may be extremely improbable, and (2) it is a symmetric distribution. Many situations are modelled better with a distribution that allows only positive values and is skewed to the right. Two of these that have been used in many real applications are the gamma and lognormal distributions. @RISK enables you to generate observations from each of these distributions. The @RISK function for the gamma distribution is RISKGAMMA, and it takes two arguments, as in =RISKGAMMA(3,10). The first argument, which must be positive, determines the shape. The smaller it is, the more skewed the distribution is to the right; the larger it is, the more symmetric the distribution is. The second argument determines the scale, in the sense that the product of it and the first argument equals the mean of the distribution. (The mean in this example is 30.) Also, the product of the second argument and the square root of the first argument is the standard deviation of the distribution. (In this example, it is 3(10=17.32.) The @RISK function for the lognormal distribution is RISKLOGNORM. It has two arguments, as in =RISKLOGNORM(40,10). These arguments are the mean and standard deviation of the distribution. Rework Example 10.2 for the following demand distributions. Do the simulated outputs have any different qualitative properties with these skewed distributions than with the triangular distribution used in the example? a. Gamma distribution with parameters 2 and 85 b. Gamma distribution with parameters 5 and 35 c. Lognormal distribution with mean 170 and standard deviation 60The method for rating teams in Example 7.8 is based on actual and predicted point spreads. This method can be biased if some teams run up the score in a few games. An alternative possibility is to base the ratings only on wins and losses. For each game, you observe whether the home team wins. Then from the proposed ratings, you predict whether the home team will win. (You predict the home team will win if the home team advantage plus the home teams rating is greater than the visitor teams rating.) You want the ratings such that the number of predictions that match the actual outcomes is maximized. Try modeling this. Do you run into difficulties? (Remember that Solver doesnt like IF functions.) EXAMPLE 7.8 RATING NFL TEAMS9 We obtained the results of the 256 regular-season NFL games from the 2015 season (the 2016 season was still ongoing as we wrote this) and entered the data into a spreadsheet, shown at the bottom of Figure 7.38. See the file NFL Ratings Finished.xlsx. (Some of these results are hidden in Figure 7.38 to conserve space.) The teams are indexed 1 to 32, as shown at the top of the sheet. For example, team 1 is Arizona, team 2 is Atlanta, and so on. The first game entered (row 6) is team 19 New England versus team 25 Pittsburgh, played at New England. New England won the game by a score of 28 to 21, and the point spread (home team score minus visitor team score) is calculated in column J. A positive point spread in column J means that the home team won; a negative point spread indicates that the visiting team won. The goal is to determine a set of ratings for the 32 NFL teams that most accurately predicts the actual outcomes of the games played.
- Referring to Example 11.1, if the average bid for each competitor stays the same, but their bids exhibit less variability, does Millers optimal bid increase or decrease? To study this question, assume that each competitors bid, expressed as a multiple of Millers cost to complete the project, follows each of the following distributions. a. Triangular with parameters 1.0, 1.3, and 2.4 b. Triangular with parameters 1.2, 1.3, and 2.2 c. Use @RISKs Define Distributions window to check that the distributions in parts a and b have the same mean as the original triangular distribution in the example, but smaller standard deviations. What is the common mean? Why is it not the same as the most likely value, 1.3?When you use a RISKSIMTABLE function for a decision variable, such as the order quantity in the Walton model, explain how this provides a fair comparison across the different values tested.Stock market analysts are continually looking for reliable predictors of stock prices. Consider the problem of modeling the price per share of electric utility stocks (Y). Two variables thought to influence this stock price are return on average equity (X1) and annual dividend rate (X2). The stock price, returns on equity, and dividend rates on a randomly selected day for 16 electric utility stocks are provided in the file P13_15.xlsx. Estimate a multiple regression equation using the given data. Interpret each of the estimated regression coefficients. Also, interpret the standard error of estimate and the R-square value for these data.