19. If other factors are held constant, explain how each of the following influences the value of the independent- measures t statistic, the likelihood of rejecting the null hypothesis, and the magnitude of measures of 22 effect size. a. Increasing the number of scores in each sample. b. Increasing the variance for each sample. As noted on page 304, when the two population means are equal, the estimated standard error for the independent-measures t test provides a measure of how much difference to expect between two sample means, For each of the following situations, assume u, and calculate how much difference that u, = Hz should be expected between the two sample means. a. One sample has n = 6 scores with SS = 75 and the second sample has n = 10 scores with SS b. One sample has n = second sample has n = 10 scores with SS = 530. c. In part b, the samples have larger variability (bigger SS values) than in part a, but the sample sizes are unchanged. How does larger variability affect the magnitude of the standard error for the sample %3D 135. 6 scores with SS = 310 and the 23 mean difference? 21. Two samples are selected from the same population. For cach of the following, calculate how much duference is expected, on average, between the two sample means. a. One sample has n the pooled variance is 60. D. One sample has n = 12, the second has n=D. and the pooled variance is 60. c. In part b, the sample sizes are larger but the pooled variance is unchanged. How does larger sample 4, the second has e 6, and 304 CHAPTER 10 | The t Test for Two Independent Samples The independent-measures t uses the difference between two sample means to evaluate a hypothesis about the difference between two population means. Thus, the independent- measures t formula is (M,- M,) - (H, - H.) sample mean difference – population mean difference estimated standard error S(M-M) In this formula, the value of M, - M, is obtained from the sample data and the value fo. u, - H, comes from the null hypothesis. In a hypothesis test, the null hypothesis sets the population mean difference equal to zero, so the independent measures t formula can ha simplified further, sample mean difference t = estimated standard error In this form, the t statistic is a simple ratio comparing the actual mean difference (numera- tor) with the difference that is expected by chance (denominator). The Estimated Standard Error In each of the t-score formulas, the standard error in the denominator measures how accurately the sample statistic represents the population parameter. In the single-sample t formula, the standard error measures the amount of error expected for a sample mean and is represented by the symbol s, For the independent- measures t formula, the standard error measures the amount of error that is expected when you use a sample mean difference (M, - M,) to represent a population mean difference (, - ,). The standard error for the sample mean difference is represented by the symbol S м-м м" Caution: Do not let the notation for standard error confuse you. In general, standard error measures how accurately a statistic represents a parameter. The symbol for standara When the statistic is a sample mean, M, the symbol for standard For the independent-measures test, the statistic is a sample mean difference error takes the form s statistic error is SM (M, - M,), and the symbol for standard error tells how much discrepancy is reasonable to expect between the sample statistic and tie corresponding population parameter. is S (M-M) In each case, the standard error Interpreting the Estimated Standard Error The estimated standard error of M, M, that appears in the bottom of the independent-measures t statistic can be interpreted in two ways. First, the standard error is defined as a measure of the standard or average distance between a sample statistic (M, - M,) and the corresponding population parameter (, - ,). As always, samples are not expected to be perfectly accurate and the standard error measures how much difference is reasonable to expect between a sample statistic and the population parameter. When the null hypothesis is true, however, the population mean difference is zero. In this case, the standard error is measuring how far, on average, the sample mean difference is from zero. However, measuring how far it is from zero is the same as measuring how big it is. Therefore, when the null hypothesis is true, the standard error is measuring how big, on average, the sample mean difference is. Thus, there are two ways to interpe the estimated standard error of (M, – M,). 1. It measures the standard distance between (M, – M,) and (u, - H2). 2. It measures the standard, or average size of (M. – M) if the null hypothhes That is, it measures how much difference is reasonable to expect between the two sample means.
19. If other factors are held constant, explain how each of the following influences the value of the independent- measures t statistic, the likelihood of rejecting the null hypothesis, and the magnitude of measures of 22 effect size. a. Increasing the number of scores in each sample. b. Increasing the variance for each sample. As noted on page 304, when the two population means are equal, the estimated standard error for the independent-measures t test provides a measure of how much difference to expect between two sample means, For each of the following situations, assume u, and calculate how much difference that u, = Hz should be expected between the two sample means. a. One sample has n = 6 scores with SS = 75 and the second sample has n = 10 scores with SS b. One sample has n = second sample has n = 10 scores with SS = 530. c. In part b, the samples have larger variability (bigger SS values) than in part a, but the sample sizes are unchanged. How does larger variability affect the magnitude of the standard error for the sample %3D 135. 6 scores with SS = 310 and the 23 mean difference? 21. Two samples are selected from the same population. For cach of the following, calculate how much duference is expected, on average, between the two sample means. a. One sample has n the pooled variance is 60. D. One sample has n = 12, the second has n=D. and the pooled variance is 60. c. In part b, the sample sizes are larger but the pooled variance is unchanged. How does larger sample 4, the second has e 6, and 304 CHAPTER 10 | The t Test for Two Independent Samples The independent-measures t uses the difference between two sample means to evaluate a hypothesis about the difference between two population means. Thus, the independent- measures t formula is (M,- M,) - (H, - H.) sample mean difference – population mean difference estimated standard error S(M-M) In this formula, the value of M, - M, is obtained from the sample data and the value fo. u, - H, comes from the null hypothesis. In a hypothesis test, the null hypothesis sets the population mean difference equal to zero, so the independent measures t formula can ha simplified further, sample mean difference t = estimated standard error In this form, the t statistic is a simple ratio comparing the actual mean difference (numera- tor) with the difference that is expected by chance (denominator). The Estimated Standard Error In each of the t-score formulas, the standard error in the denominator measures how accurately the sample statistic represents the population parameter. In the single-sample t formula, the standard error measures the amount of error expected for a sample mean and is represented by the symbol s, For the independent- measures t formula, the standard error measures the amount of error that is expected when you use a sample mean difference (M, - M,) to represent a population mean difference (, - ,). The standard error for the sample mean difference is represented by the symbol S м-м м" Caution: Do not let the notation for standard error confuse you. In general, standard error measures how accurately a statistic represents a parameter. The symbol for standara When the statistic is a sample mean, M, the symbol for standard For the independent-measures test, the statistic is a sample mean difference error takes the form s statistic error is SM (M, - M,), and the symbol for standard error tells how much discrepancy is reasonable to expect between the sample statistic and tie corresponding population parameter. is S (M-M) In each case, the standard error Interpreting the Estimated Standard Error The estimated standard error of M, M, that appears in the bottom of the independent-measures t statistic can be interpreted in two ways. First, the standard error is defined as a measure of the standard or average distance between a sample statistic (M, - M,) and the corresponding population parameter (, - ,). As always, samples are not expected to be perfectly accurate and the standard error measures how much difference is reasonable to expect between a sample statistic and the population parameter. When the null hypothesis is true, however, the population mean difference is zero. In this case, the standard error is measuring how far, on average, the sample mean difference is from zero. However, measuring how far it is from zero is the same as measuring how big it is. Therefore, when the null hypothesis is true, the standard error is measuring how big, on average, the sample mean difference is. Thus, there are two ways to interpe the estimated standard error of (M, – M,). 1. It measures the standard distance between (M, – M,) and (u, - H2). 2. It measures the standard, or average size of (M. – M) if the null hypothhes That is, it measures how much difference is reasonable to expect between the two sample means.

MATLAB: An Introduction with Applications
6th Edition
ISBN:9781119256830
Author:Amos Gilat
Publisher:Amos Gilat
Chapter1: Starting With Matlab
Section: Chapter Questions
Problem 1P

Related questions

Question
Need help on Number 20
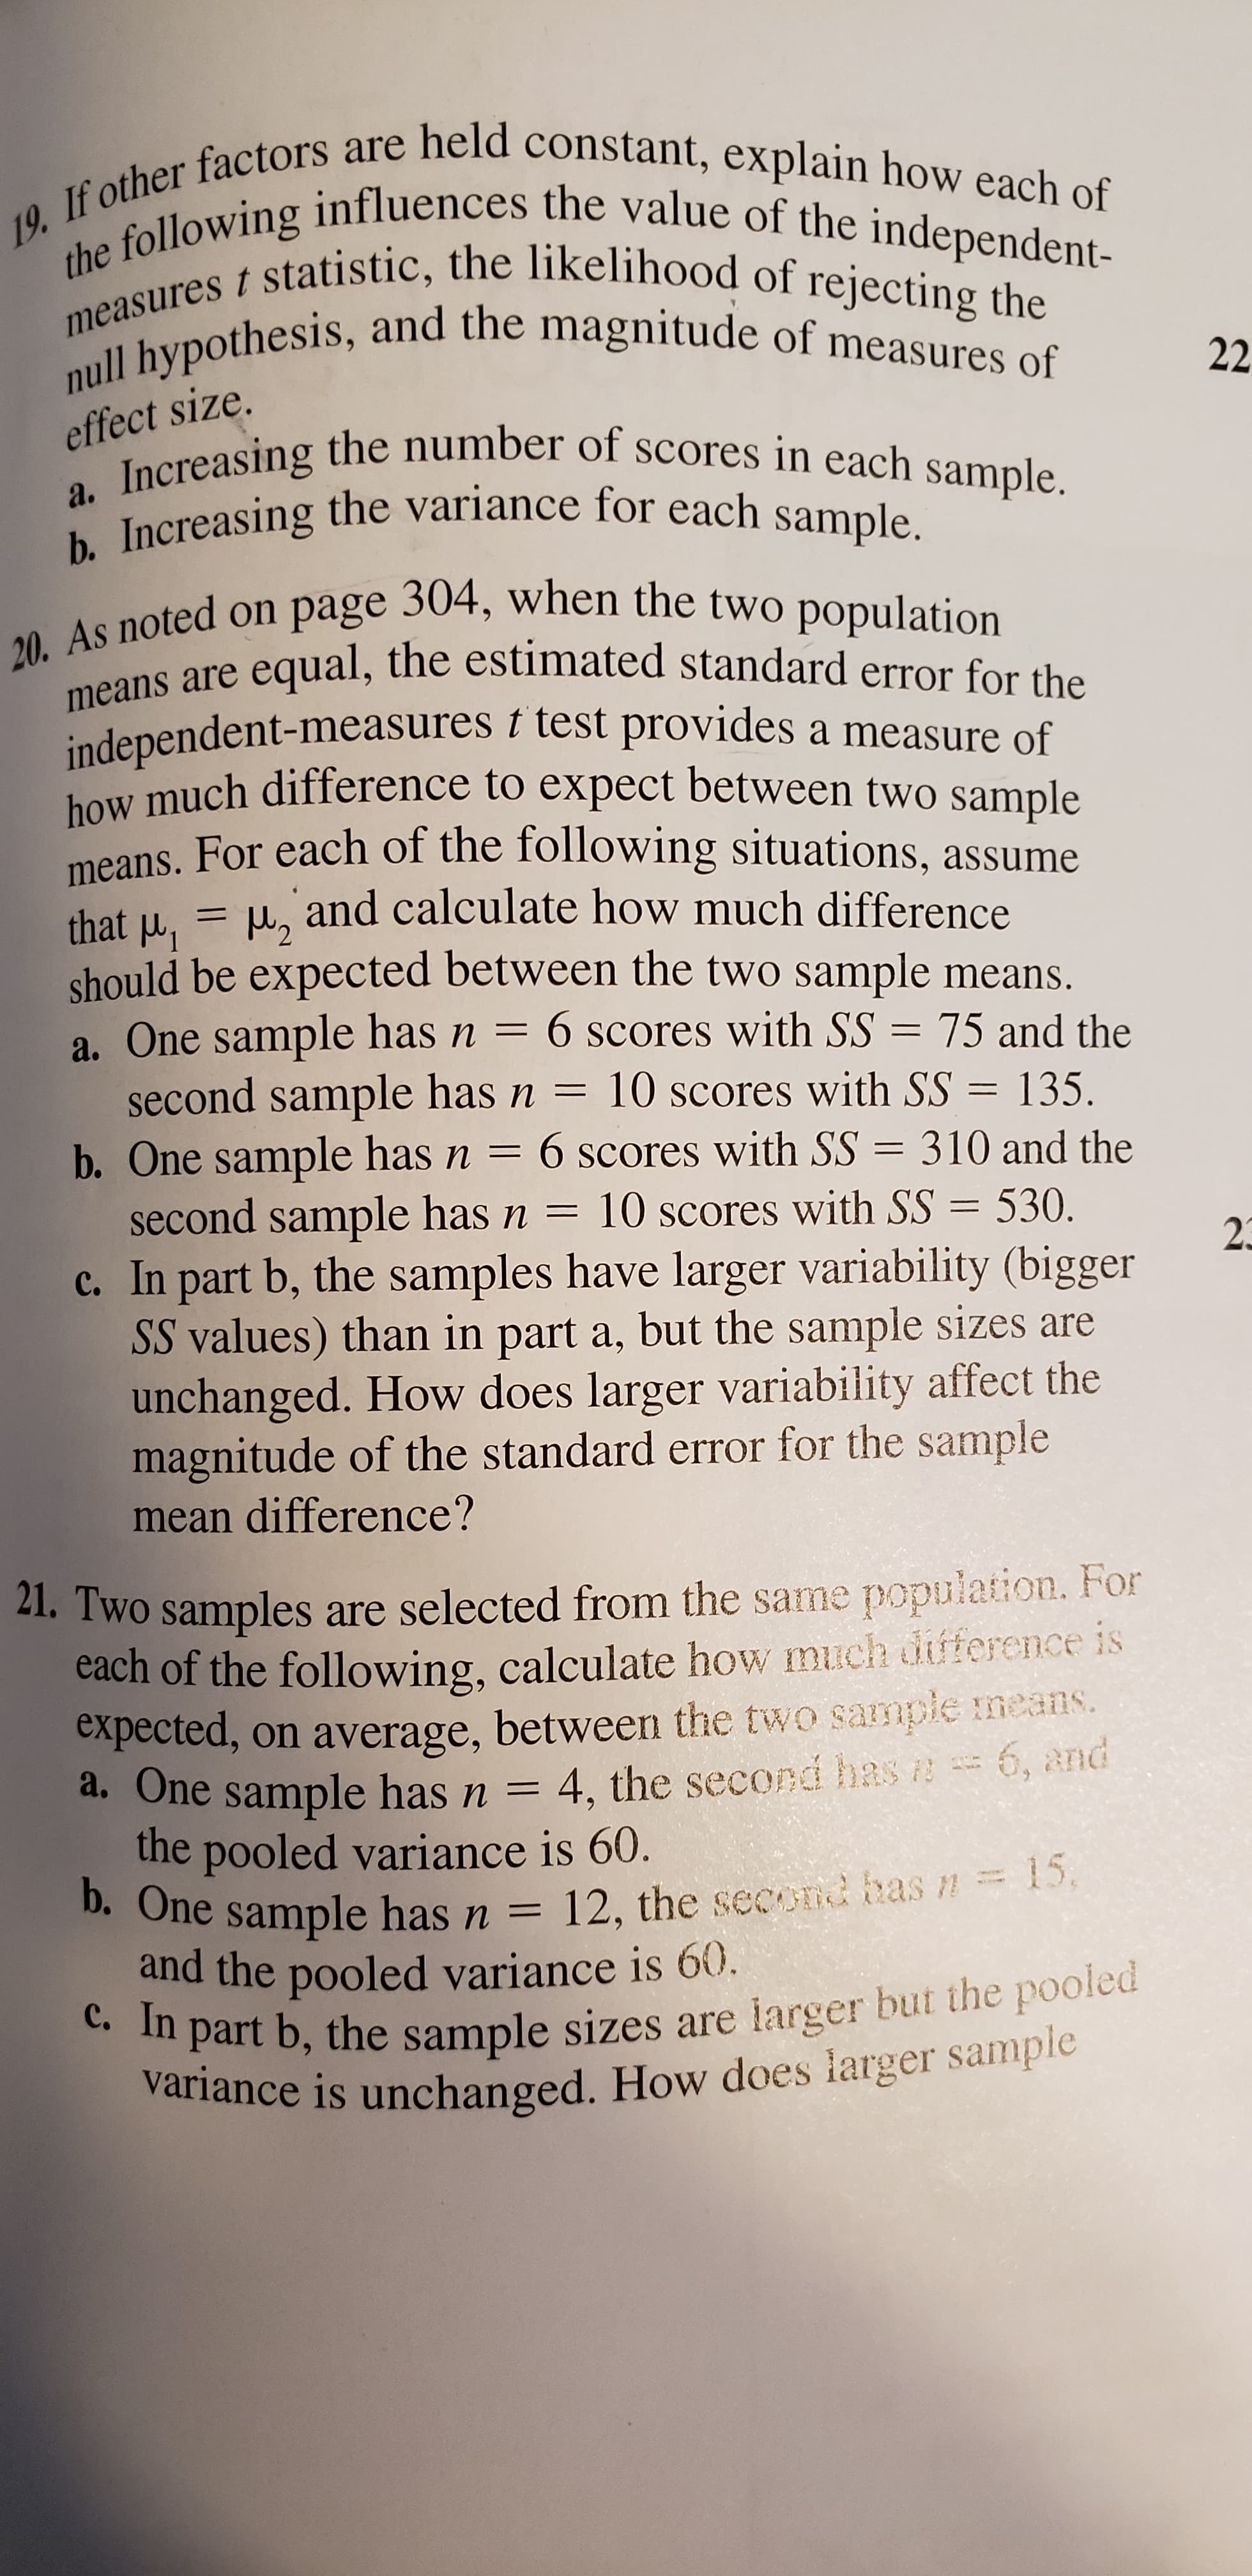
Transcribed Image Text:19. If other factors are held constant, explain how each of
the following influences the value of the independent-
measures t statistic, the likelihood of rejecting the
null hypothesis, and the magnitude of measures of
22
effect size.
a. Increasing the number of scores in each sample.
b. Increasing the variance for each sample.
As noted on page 304, when the two population
means are equal, the estimated standard error for the
independent-measures t test provides a measure of
how much difference to expect between two sample
means, For each of the following situations, assume
u, and calculate how much difference
that u, = Hz
should be expected between the two sample means.
a. One sample has n = 6 scores with SS = 75 and the
second sample has n = 10 scores with SS
b. One sample has n =
second sample has n = 10 scores with SS = 530.
c. In part b, the samples have larger variability (bigger
SS values) than in part a, but the sample sizes are
unchanged. How does larger variability affect the
magnitude of the standard error for the sample
%3D
135.
6 scores with SS = 310 and the
23
mean difference?
21. Two samples are selected from the same population. For
cach of the following, calculate how much duference is
expected, on average, between the two sample means.
a. One sample has n
the pooled variance is 60.
D. One sample has n = 12, the second has n=D.
and the pooled variance is 60.
c. In part b, the sample sizes are larger but the pooled
variance is unchanged. How does larger sample
4, the second has e 6, and
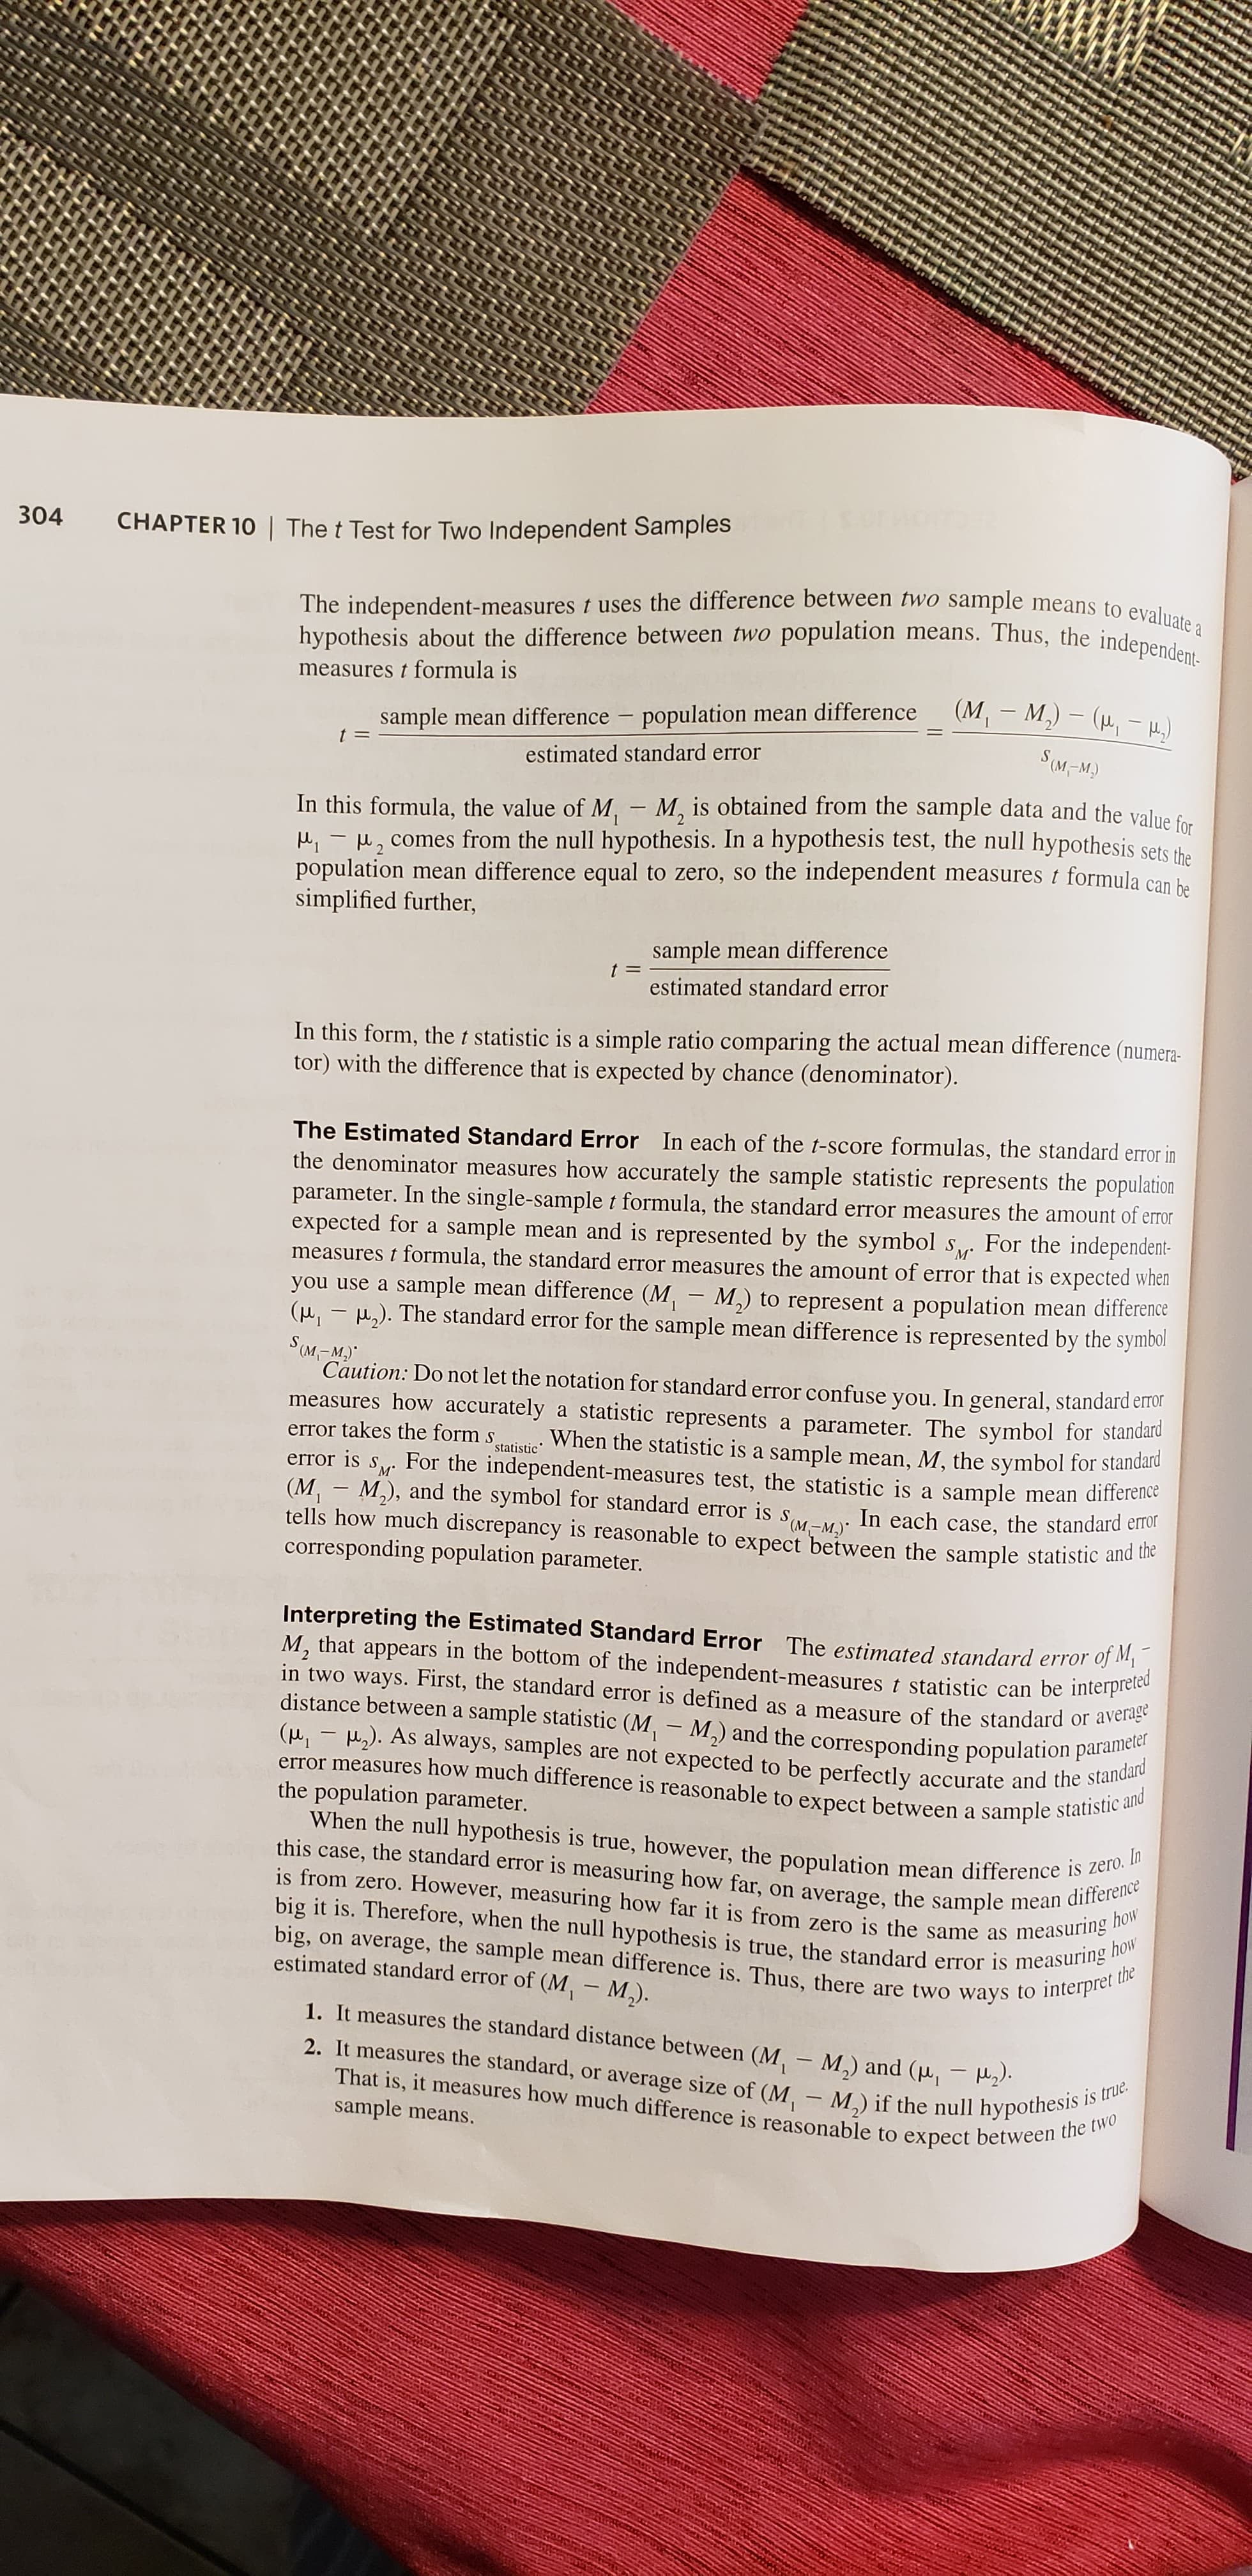
Transcribed Image Text:304
CHAPTER 10 | The t Test for Two Independent Samples
The independent-measures t uses the difference between two sample means to evaluate a
hypothesis about the difference between two population means. Thus, the independent-
measures t formula is
(M,- M,) - (H, - H.)
sample mean difference – population mean difference
estimated standard error
S(M-M)
In this formula, the value of M, - M, is obtained from the sample data and the value fo.
u, - H, comes from the null hypothesis. In a hypothesis test, the null hypothesis sets the
population mean difference equal to zero, so the independent measures t formula can ha
simplified further,
sample mean difference
t =
estimated standard error
In this form, the t statistic is a simple ratio comparing the actual mean difference (numera-
tor) with the difference that is expected by chance (denominator).
The Estimated Standard Error In each of the t-score formulas, the standard error in
the denominator measures how accurately the sample statistic represents the population
parameter. In the single-sample t formula, the standard error measures the amount of error
expected for a sample mean and is represented by the symbol s, For the independent-
measures t formula, the standard error measures the amount of error that is expected when
you use a sample mean difference (M, - M,) to represent a population mean difference
(, - ,). The standard error for the sample mean difference is represented by the symbol
S м-м
м"
Caution: Do not let the notation for standard error confuse you. In general, standard error
measures how accurately a statistic represents a parameter. The symbol for standara
When the statistic is a sample mean, M, the symbol for standard
For the independent-measures test, the statistic is a sample mean difference
error takes the form s
statistic
error is
SM
(M, - M,), and the symbol for standard error
tells how much discrepancy is reasonable to expect between the sample statistic and tie
corresponding population parameter.
is
S (M-M)
In each case, the standard error
Interpreting the Estimated Standard Error The estimated standard error of M,
M, that appears in the bottom of the independent-measures t statistic can be interpreted
in two ways. First, the standard error is defined as a measure of the standard or average
distance between a sample statistic (M, - M,) and the corresponding population parameter
(, - ,). As always, samples are not expected to be perfectly accurate and the standard
error measures how much difference is reasonable to expect between a sample statistic and
the population parameter.
When the null hypothesis is true, however, the population mean difference is zero. In
this case, the standard error is measuring how far, on average, the sample mean difference
is from zero. However, measuring how far it is from zero is the same as
measuring how
big it is. Therefore, when the null hypothesis is true, the standard error is measuring how
big, on average, the sample mean difference is. Thus, there are two ways to interpe
the
estimated standard error of (M, – M,).
1. It measures the standard distance between (M, – M,) and (u, - H2).
2. It measures the standard, or average size of (M. – M) if the null hypothhes
That is, it measures how much difference is reasonable to expect between the two
sample means.
Expert Solution
This question has been solved!
Explore an expertly crafted, step-by-step solution for a thorough understanding of key concepts.

This is a popular solution!

Trending now
This is a popular solution!

Step by step
Solved in 2 steps with 2 images

Knowledge Booster


Learn more about
Need a deep-dive on the concept behind this application? Look no further. Learn more about this topic, statistics and related others by exploring similar questions and additional content below.Recommended textbooks for you
MATLAB: An Introduction with Applications
Statistics
ISBN:
9781119256830
Author:
Amos Gilat
Publisher:
John Wiley & Sons Inc

Probability and Statistics for Engineering and th…
Statistics
ISBN:
9781305251809
Author:
Jay L. Devore
Publisher:
Cengage Learning

Statistics for The Behavioral Sciences (MindTap C…
Statistics
ISBN:
9781305504912
Author:
Frederick J Gravetter, Larry B. Wallnau
Publisher:
Cengage Learning
MATLAB: An Introduction with Applications
Statistics
ISBN:
9781119256830
Author:
Amos Gilat
Publisher:
John Wiley & Sons Inc
Probability and Statistics for Engineering and th…
Statistics
ISBN:
9781305251809
Author:
Jay L. Devore
Publisher:
Cengage Learning
Statistics for The Behavioral Sciences (MindTap C…
Statistics
ISBN:
9781305504912
Author:
Frederick J Gravetter, Larry B. Wallnau
Publisher:
Cengage Learning

Elementary Statistics: Picturing the World (7th E…
Statistics
ISBN:
9780134683416
Author:
Ron Larson, Betsy Farber
Publisher:
PEARSON

The Basic Practice of Statistics
Statistics
ISBN:
9781319042578
Author:
David S. Moore, William I. Notz, Michael A. Fligner
Publisher:
W. H. Freeman

Introduction to the Practice of Statistics
Statistics
ISBN:
9781319013387
Author:
David S. Moore, George P. McCabe, Bruce A. Craig
Publisher:
W. H. Freeman