19.5 (0) A profit-maximizing firm produces one output, y, and uses one input, r, to produce it. The price per unit of the factor is denoted by
19.5 (0) A profit-maximizing firm produces one output, y, and uses one input, r, to produce it. The price per unit of the factor is denoted by

Chapter1: Making Economics Decisions
Section: Chapter Questions
Problem 1QTC

Related questions
Question
Transcribed Image Text:19.5 (0) A profit-maximizing firm produces one output, y, and uses one
input, r, to produce it. The price per unit of the factor is denoted by
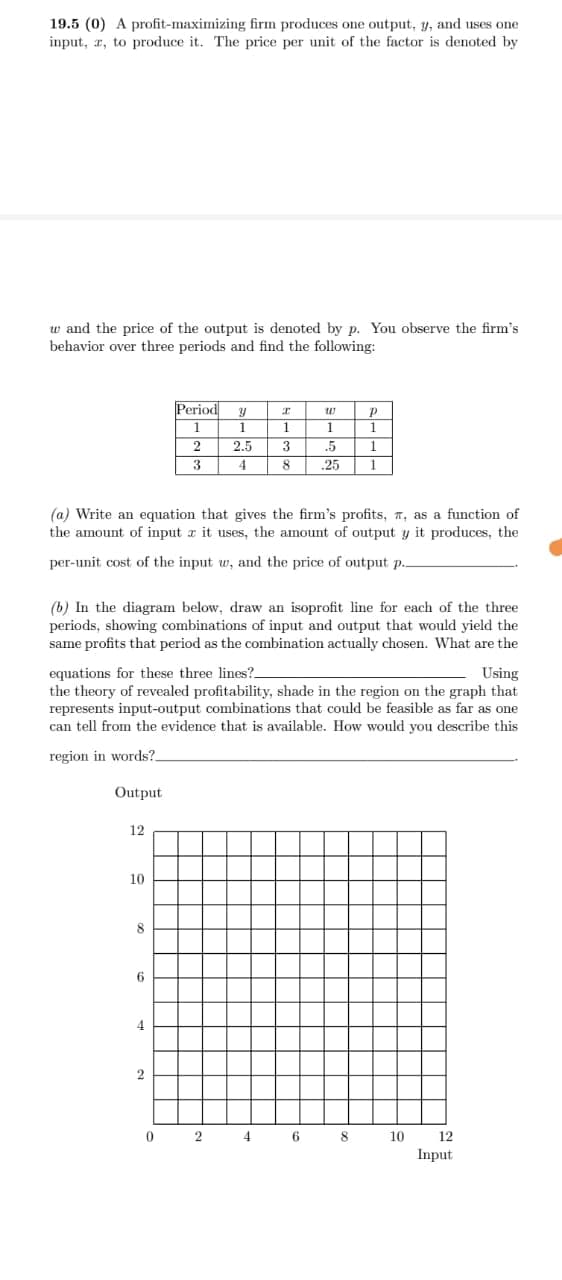
w and the price of the output is denoted by p. You observe the firm's
behavior over three periods and find the following:
Period
1
1
1
1
1
2.5
.5
3
4
.25
(a) Write an equation that gives the firm's profits, n, as a function of
the amount of input z it uses, the amount of output y it produces, the
per-unit cost of the input w, and the price of output p.
(b) In the diagram below, draw an isoprofit line for each of the three
periods, showing combinations of input and output that would yield the
same profits that period as the combination actually chosen. What are the
equations for these three lines?.
the theory of revealed profitability, shade in the region on the graph that
represents input-output combinations that could be feasible as far as one
can tell from the evidence that is available. How would you describe this
Using
region in words?
Output
12
10
4
8
10
12
Input
Expert Solution
This question has been solved!
Explore an expertly crafted, step-by-step solution for a thorough understanding of key concepts.

Step by step
Solved in 2 steps

Knowledge Booster


Learn more about
Need a deep-dive on the concept behind this application? Look no further. Learn more about this topic, economics and related others by exploring similar questions and additional content below.Recommended textbooks for you

Principles of Economics (12th Edition)
Economics
ISBN:
9780134078779
Author:
Karl E. Case, Ray C. Fair, Sharon E. Oster
Publisher:
PEARSON

Engineering Economy (17th Edition)
Economics
ISBN:
9780134870069
Author:
William G. Sullivan, Elin M. Wicks, C. Patrick Koelling
Publisher:
PEARSON
Principles of Economics (12th Edition)
Economics
ISBN:
9780134078779
Author:
Karl E. Case, Ray C. Fair, Sharon E. Oster
Publisher:
PEARSON
Engineering Economy (17th Edition)
Economics
ISBN:
9780134870069
Author:
William G. Sullivan, Elin M. Wicks, C. Patrick Koelling
Publisher:
PEARSON

Principles of Economics (MindTap Course List)
Economics
ISBN:
9781305585126
Author:
N. Gregory Mankiw
Publisher:
Cengage Learning

Managerial Economics: A Problem Solving Approach
Economics
ISBN:
9781337106665
Author:
Luke M. Froeb, Brian T. McCann, Michael R. Ward, Mike Shor
Publisher:
Cengage Learning

Managerial Economics & Business Strategy (Mcgraw-…
Economics
ISBN:
9781259290619
Author:
Michael Baye, Jeff Prince
Publisher:
McGraw-Hill Education