Fitted Residuals values -11118.35 Total 53236.35 Total yhat 39806.44 -4648.438 state income 35158 spending 6953 1. Alabama Alaska Arizona Arkansas California Colorado Connecticut 11432 47651.06 37428 39298.52 -5052.525 41394.98 42780.36 49335.93 45750.77 52499 40762 4847.938 3333.995 5595 6663 7860 8651 34246 50220 50538 56803 50583 42118 8825.021 7757.646 7467.069 4832.232 6. 7. 12394 10347 De laware 9 District of Columbia 14621 53236.35 -11118.35


Correlation
Correlation defines a relationship between two independent variables. It tells the degree to which variables move in relation to each other. When two sets of data are related to each other, there is a correlation between them.
Linear Correlation
A correlation is used to determine the relationships between numerical and categorical variables. In other words, it is an indicator of how things are connected to one another. The correlation analysis is the study of how variables are related.
Regression Analysis
Regression analysis is a statistical method in which it estimates the relationship between a dependent variable and one or more independent variable. In simple terms dependent variable is called as outcome variable and independent variable is called as predictors. Regression analysis is one of the methods to find the trends in data. The independent variable used in Regression analysis is named Predictor variable. It offers data of an associated dependent variable regarding a particular outcome.
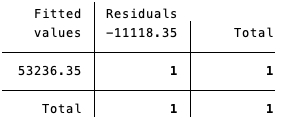
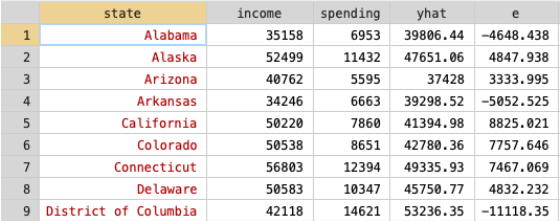
Based on these charts what is the predicted level of spending per pupil in the District of Columbia? What is the residual (the difference between actual and predicted value) for DC? Does the model over or under predict spending per pupil in DC? What factors might account for this error?


Trending now
This is a popular solution!

Step by step
Solved in 2 steps with 1 images


