The table lists the average tuition and fees at private colleges and universities for selected years. Year 1985 1990 1995 2000 2008 Tuition and Fees 5404 9396 12,385 16,139 25,146 (in dollars) ..... (a) Find the equation of the least-squares regression line that models the data. (Type the slope as a decimal rounded to three decimal places. Round the y-intercept to the nearest integer.)
The table lists the average tuition and fees at private colleges and universities for selected years. Year 1985 1990 1995 2000 2008 Tuition and Fees 5404 9396 12,385 16,139 25,146 (in dollars) ..... (a) Find the equation of the least-squares regression line that models the data. (Type the slope as a decimal rounded to three decimal places. Round the y-intercept to the nearest integer.)

Algebra & Trigonometry with Analytic Geometry
13th Edition
ISBN:9781133382119
Author:Swokowski
Publisher:Swokowski
Chapter5: Inverse, Exponential, And Logarithmic Functions
Section5.6: Exponential And Logarithmic Equations
Problem 67E

Related questions
Question
Please
*Find the equation of the least-squares regression line that models the data.
*Graph the data and the regression line in the same viewing window using the parameters given below the graph choices. Choose the correct graph below.
*Estimate the tuition and fees in 2005.
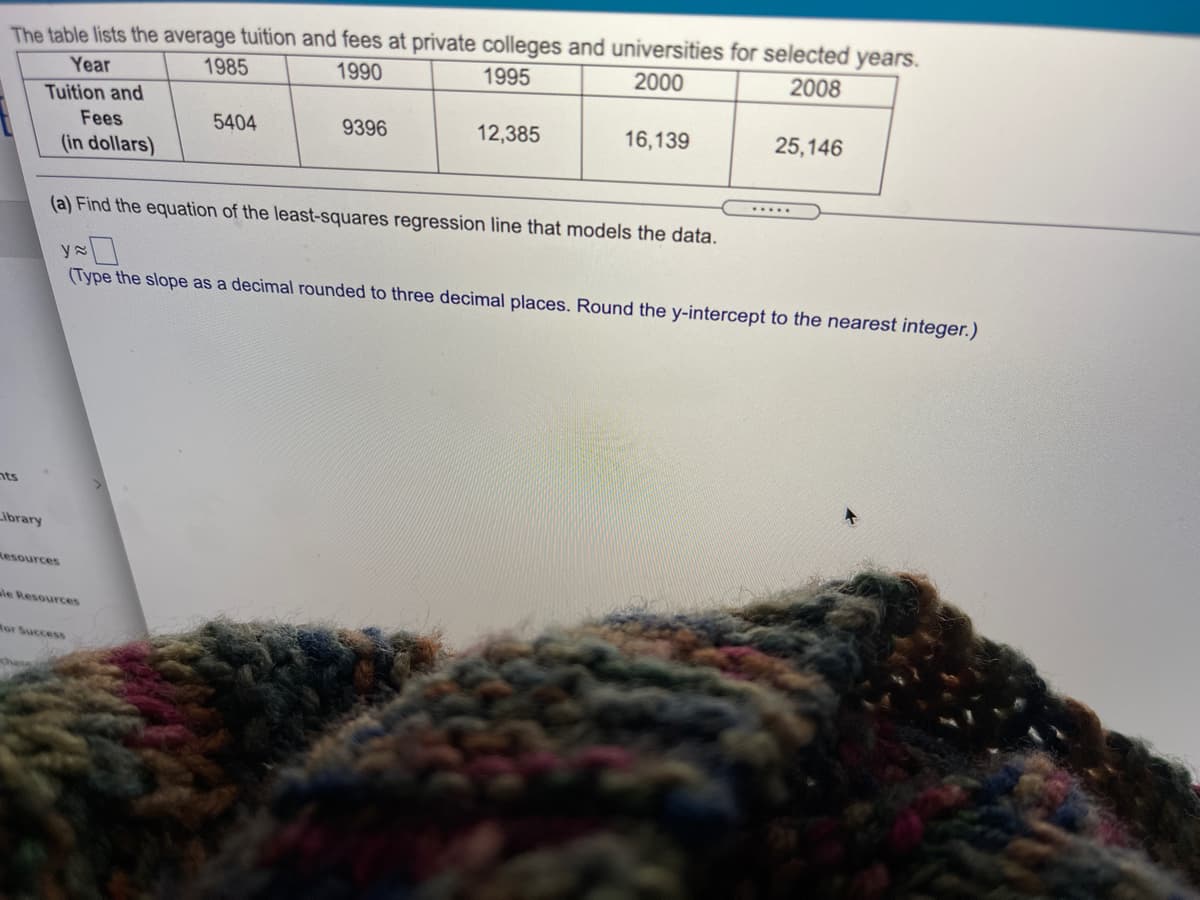
Transcribed Image Text:The table lists the average tuition and fees at private colleges and universities for selected years.
1995
Year
1985
1990
2000
2008
Tuition and
Fees
5404
9396
12,385
16,139
25,146
(in dollars)
(a) Find the equation of the least-squares regression line that models the data.
(Type the slope as a decimal rounded to three decimal places. Round the y-intercept to the nearest integer.)
nts
ibrary
Resources
le Resources
Ror Success
chane
Expert Solution
This question has been solved!
Explore an expertly crafted, step-by-step solution for a thorough understanding of key concepts.

This is a popular solution!

Trending now
This is a popular solution!

Step by step
Solved in 3 steps with 5 images

Recommended textbooks for you
Algebra & Trigonometry with Analytic Geometry
Algebra
ISBN:
9781133382119
Author:
Swokowski
Publisher:
Cengage

Trigonometry (MindTap Course List)
Trigonometry
ISBN:
9781305652224
Author:
Charles P. McKeague, Mark D. Turner
Publisher:
Cengage Learning

Algebra & Trigonometry with Analytic Geometry
Algebra
ISBN:
9781133382119
Author:
Swokowski
Publisher:
Cengage
Trigonometry (MindTap Course List)
Trigonometry
ISBN:
9781305652224
Author:
Charles P. McKeague, Mark D. Turner
Publisher:
Cengage Learning

Big Ideas Math A Bridge To Success Algebra 1: Stu…
Algebra
ISBN:
9781680331141
Author:
HOUGHTON MIFFLIN HARCOURT
Publisher:
Houghton Mifflin Harcourt