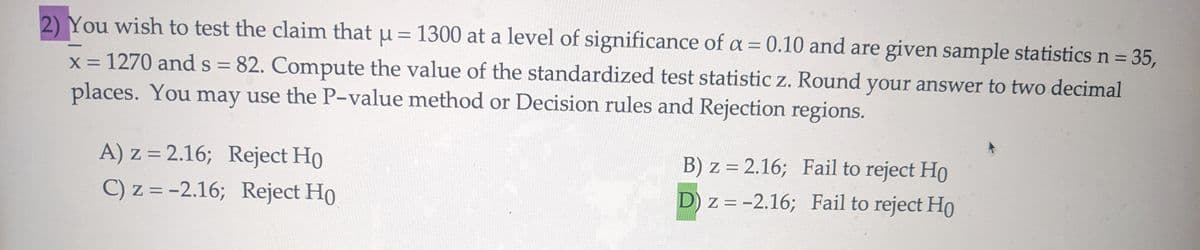
2) You wish to test the claim that μ = 1300 at a level of significance of a = 0.10 and are given sample statistics n = x = 1270 and s = 82. Compute the value of the standardized test statistic z. Round your answer to two decimal places. You may use the P-value method or Decision rules and Rejection regions. A) z = 2.16; Reject Ho C) z = -2.16; Reject Ho B) z = 2.16; Fail to reject Ho D) z = -2.16; Fail to reject Ho 35,


Q: The accompanying data file shows the annual returns (in %) for a mutual fund focusing on investments…
A: Latin…
Q: ŷ18.53.9x1 - 2x2 +7.6x3 + 2.5x4 The following estimated regression equation is based on 30…
A: Given:SST = 1804SSR = 1761n = 30Regression equation: ŷ = 18.5 + 3.9x1 - 2x2 +7.6x3 +2.5x4 a. Solve…
Q: D. What is the predicted grade point average for someone whose IQ is 115? E. Does there appear to be…
A: E)The correlation between IQ and grade point average (GPA) can vary depending on several factors,…
Q: Let X Є pxn denote a zero mean observation matrix matrix of obser- vations, P be a pxp orthogonal…
A: (a) To show that PTCP is the covariance matrix ofY=PTX, we need to prove that PTCP=cov(Y). The…
Q: Please answer the questions in excel the photo and show the excel equations used. Answer the…
A: I can access or process images directly, but based on your description, it looks like you have a…
Q: You hypothesize that people in stats classes are happier than people in all other classes. You…
A: The objective of the question is to calculate the degrees of freedom within samples in a one-way…
Q: 4.Suppose that the random variable x has the following table Class Freq. 0-7 2 8-15 10 . Calculate…
A: Step 1: Finding Midpoints of frequency distribution Interval Mid-point(m)…
Q: POINTS – A person's temperature, T in degrees Fahrenheit, during an illness is given by the function…
A: Step 1:The graph of function as follows: Step 2:b) At t=0, The function is = 98.6.At t=1,=…
Q: Please don’t answer the question with programming. Don’t use codes to answer the question.
A: Step 1: To solve this problem, let's start by filling in the missing values in the ANOVA table. We…
Q: The number of sodas a vendor sells daily has the probability distribution represented in the table.…
A: Step 1: State the given table: Price of soda, C = $2.50 Step 2: Determine the mean of the…
Q: I need help with parts a and b please
A: Approach to solving the question: The least square method. Detailed explanation: a) Given values are…
Q: Researchers have shown that there is a positive correlation between average fat intake and the…
A: The question is asking whether a positive correlation between average fat intake and breast cancer…
Q: 4. Based on several years of past experience, a doctor's office knows that on a typical consultation…
A: A. You can find the probability that a patient has either sickness 1 or sickness 2 by adding their…
Q: Nominal Logistic Fit for PassClass(Words) Logistic Plot 1.00 PassClass(Words) 0.75 0.50- 0.25 0.00…
A: Explanation:A nominal logistic regression was used in this particular context to examine the…
Q: vm7 2 A test was given to a group of students. The grades and gender are summarized below A B C…
A:
Q: Suppose the round-trip airfare between Boston and Orlando follows the normal probability…
A: Step 1: Given informationMean = $387.20Standard deviation = $68.50The distribution used is normal…
Q: 2. For a chi-squared distribution, find x such that (a) P(X² > x²) = 0.99 when v = 4; (b) P(X² > x²)…
A: Step 1:For a chi−square distribution,find Xα2Part a: X_{\alpha}^2 )=0.99 \ , when \ v=4…
Q: 1:23A 5G 33 8-2 Final Exam i Saved Save & Exit Submit 6 The distribution pictured below is Multiple…
A: Please refer to the solution.
Q: Assume that the random variable X is normally distributed, with mean u = 52 and standard deviation 0…
A: The objective of this question is to find the probability that the random variable X, which is…
Q: None
A: Let's take a closer look at each step. 1. ConjecturesThe null hypothesis Ho, which asserts that…
Q: The probability that a person who identifies as male will be color-blind is 0.044. Find the…
A: The scenario above would satisfy all conditions of binomial distributions:• Fixed number of trials…
Q: please answer in text form and in proper format answer with must explanation , calculation for each…
A: To solve this linear optimization problem, we need to follow these steps: Step 1: Define the…
Q: Derive a Formula For the Function generating the central Moments of distribution EXP(8) a A المال من…
A: Solution-
Q: police belive that 65% of drivers traveling on a major interstate exceed the speed limit. how many…
A: The objective of this question is to determine the sample size needed to create a 95% confidence…
Q: 3. A UCLA researcher claims that the life span of mice can be extended by as much as 25% when the…
A: Question(3):Solution:Step 1:Find the Z-score corresponding to a 99% confidence level.The information…
Q: Two sample are randomly selected from each population. The statistics are given below
A: To find the P-value for testing the claim that μ1=μ2, we can use a two-sample Z-test since the…
Q: The average driver spends $39 at the gas station each week with a standard deviation of $11.…
A: Step 1: Let, X be the random variable representing the amount a driver spends on gas following the…
Q: If 94% of my data point are about a given number is the information left or right skewed?
A: If 94% of your data points are about a given number, it indicates that the distribution is highly…
Q: If the sum of squared raw residuals is 1333.66 and the sum of the squared total residuals is 3236.05…
A: To find the coefficient of determination (R-squared), we use the formula:Let's say, the sum of…
Q: The mean travel time to work is 25.2 minutes (U.S. Census). Further, suppose that commute time…
A: The objective of this question is to find the probability that a randomly selected U.S. worker has a…
Q: Let X be a random variable with the following probability distribution. Value x of X P(X=x) 2 0.05 3…
A: Step 1: From the provided information,Value x of XP (X=x)20.0530.0540.0550.85 Step 2: Expectation of…
Q: The current in a semiconductor diode is often measured by the Shockley equation I = 10(eav 1) where…
A: Step 1:Step 2:
Q: please answer in text form and in proper format answer with must explanation , calculation for each…
A: Based on the information you .Factors Affecting Torque Recommendation:Material Properties:Tensile…
Q: 5.4.6. Let Ymin be the smallest order statistic in a random sample of size n drawn from the uniform…
A:
Q: In conducting a test on the hypotheses Ho: μ = 50 and Ha: μ > 50, you find that the population mean…
A: Let us first understand the two types of error that occurs in a hypothesis testing. A type I error…
Q: please answer in text form and in proper format answer with must explanation , calculation for each…
A: The objective of the question is to find the probability that the baker will sell exactly one batch…
Q: A sociologist develops a test to measure attitudes about public transportation and 11 randomly…
A: Given information :Mean(xˉ)=76.2s=21.4n=11c=95%=0.95Step 2:The margin of error calculated by the…
Q: None
A: The manufacturer sells shoes to the distributor, the distributor sells shoes to the retailer, and…
Q: please answer in text form and in proper format answer with must explanation , calculation for each…
A: I can help you solve the question about the probability density function (PDF) f(x) = { C√(2x + 1),…
Q: 8. P | ((PQ) Q)
A:
Q: Please read the question in the picture and answer the questions in excel with the formulas used.…
A: I can guide you through the steps to solve a chi-square test problem in Excel and explain the…
Q: Suppose that a regression equation for the relationship between y = weight (pounds) and x = height…
A:
Q: Hello expert, I need to solve the question step by step and in clear writing If he X-N(μ, o²) 1) The…
A: Hope this answer is clear to you, if any doubt then raise it.Kindly do rate this helpful.....Thank…
Q: A paired difference experiment produced the accompanying results. Complete parts a through e. nd =…
A: Step 1:Given:nd = 34x̄1 = 90.5x̄2 = 95.7x̄d = -5.2s2d = 23s = √23 = 4.80 Step 2:(a) Determine the…
Q: Hanny
A: Step 1: Step 2: Step 3: Step 4:
Q: A chemist wishes to test the effect of four chemical agents on the strength of a particular type of…
A: The objective of the question is to analyze the effect of different chemical agents on the strength…
Q: 8. An electrical firm manufactures light bulbs that have a length life with normal distribution, and…
A: Question 8. To find the upper and lower 95% bounds for the average length life of the light bulbs,…
Q: please answer in text form and in proper format answer with must explanation , calculation for each…
A: Step 1: Step 2: Step 3: Step 4:
Q: IF it was X~ EXP(0) Prove that Pr(x<x/xza)= F(x)
A: References Spivak, M. (2018). Calculus on manifolds: a modern approach to classical theorems of…
Q: Directions: Show all your work. Indicate clearly the methods you use, because you will be scored on…
A: Chi-Square Test for IndependenceState the HypothesesNull hypothesis (H₀): There is no association…
You wish to test the claim u=1300 at a level of significance of a=0.10 and are given sample statistics n=35, x=1270 and s=82. Compute the value of standardized test statistic z. Round your answer to two decimal places . You may use the P- value method or decision rules and rejection regions

Unlock instant AI solutions
Tap the button
to generate a solution
Click the button to generate
a solution
- What is meant by the sample space of an experiment?7. Listed below are measured fuel consumption amounts (in miles per gallon) for a random sample of cars. Acura Rl Acura TSX Audi A6 BMW 525i City Fuel Consumption 18 22 21 21 Highway Fuel Consumption 26 31 29 28 We are going to do a matched pairs test to see if there is sufficient evidence at the 5% significance level to support the claim that there is a difference in city and highway fuel consumption. a. Define the parameter and state the hypotheses. b. Find the observed sample statistic and the test statistic. Use proper notation for the sample statistic (x or pˆ), and clearly identify your test statistic as either a z-score or a t-score. c. Find the p-value of your test statistic. You are required to graph the test statistic on its corresponding distribution, shade the appropriate area, and provide correct calculator documentation. Box final answer. d. Make a generic decision about H0. e. Make a conclusion in the context of the problem. f. Do you have any…The U.S. Census Bureau conducts annual surveys to obtain information on the percentage of the voting-age population that is registered to vote. Suppose that 713 employed persons and 613 unemployed persons are independently and randomly selected and that 338 of the employed persons and 244 of the unemployed persons have registered to vote. Can we conclude that the percentage of employed workers ( p1 ), who have registered to vote, exceeds the percentage of unemployed workers ( p2 ), who have registered to vote? Use a significance level of α=0.1 for the test. Step 1 of 6 : State the null and alternative hypotheses for the test. Step 2 of 6 : Find the values of the two sample proportions, pˆ1p^1 and pˆ2p^2. Round your answers to three decimal places. Step 3 of 6 : Compute the weighted estimate of p, p‾p‾. Round your answer to three decimal places. Step 4 of 6 : Compute the value of the test statistic. Round your answer to two decimal places.…
- Determine the critical value(s) for a one sample hypothesis test for proportions that has a two tailed alternative hypothesis and is using =0.02.The drug Lipitor is meant to reduce cholesterol and LDL cholesterol. In clinical trials, 19 out of 863 patients taking 10 mg of Lipitor daily complained of flulike symptoms. Suppose that it is known that 1.9% patients taking competing drugs complain of flulike symptoms. (a) Determine the sample proportion of patients taking 10 mg of Lipitor daily complained of flulike symptoms. (b) Suppose that we want to know whether the evidence suggests more than 1.9% of Lipitor users experience flu-like symptoms as a side effect. Write down the null and alternative hypotheses. (c) Check whether the conditions for hypothesis testing using the P-value approach are met. (d) Determine the P-value for this hypothesis test, and draw a normal curve with area representing the P-value shaded. (e) Interpret the P-value.A manufacturer of nickel-hydrogen batteries randomly selects 100 nickel plates for test cells, cycles them a specified number of times, and determines that 14 of the plates have blistered. Does this provide compelling evidence for concluding that more than 10% ofplates blister under such circumstances?A) State H0 and Ha B) Test the hypothesis using the P-Value approach at a significance level of 4.5%, and express your decision. C) Based on the given data, determine the extreme value without rejecting the H0.
- Comfort Food Magazine states the average calories of a medium size hot dog is 209. The number of calories for a medium size hot dog is normally distributed. A random sample of 15 different brands of medium size hot dogs resulted in the following calorie count provided below. Can it be concluded that the average calories of a medium size hot dog will be 209 based on level significance of 0.01?The owner of a machine shop must decide which of two snack-vending machines to install in his shop. If each machine tested 250 times, the first machine fails to work (neither delivers the snack nor returns the money) 13 times, and the second machine fails to work 7 times, test at the 0.05 level of significance whether the difference between the corresponding sample proportions is significant.Assume that a simple random sample has been selected and test the given claim. Use the diastolic blood pressure measurements (in mm Hg) for adult females listed in the accompanying data table and test the claim that the adult female population has a mean diastolic blood pressure level less than 90 mm Hg. Suppose a diastolic blood pressure above 90 is considered to be hypertension. Use a 0.10 significance level. Based on the result, can we conclude that none of the adult females in the sample have hypertension? 719481677481565073876762726165875685696270738670646868827591617278908460788278827662637661696654677163727865856294567676567768924747656957716571726874657354588273686564865577745191578183766672638955767889647179417370457188786966737865976871646967725967545572677477407256708063736667559671638553 FIND TEST STATISTIC AND P VALUE
- Assume that a simple random sample has been selected and test the given claim. Use the diastolic blood pressure measurements (in mm Hg) for adult females listed in the accompanying data table and test the claim that the adult female population has a mean diastolic blood pressure level less than 90mm Hg. Suppose a diastolic blood pressure above 90 is considered to be hypertension. Use a 0.10 significance level. Based on the result, can we conclude that none of the adult females in the sample have hypertension? 699679657181595074886958716464885583726370728972666772837489617175928662798177847559657660666452677262717865866095577575587964914646677157726873706673647157578271726565835476745291568383786871618957777689637181437274447187806867717965976770636768756169525568677475407354697865736368549470658553 Identify the value of the test statistic. Identify the P-value.A newspaper article says that on average, college freshmen spend 7.5 hours a week going to parties. One administrator does not believe that these figures apply at her college, which has nearly 3,000 freshmen. She takes a simple random sample of 100 freshmen and interviews them. On average, they report 6.6 hours a week going to parties, and the SD is 9 hours. Carry out all the steps of performing a one-sample z test, and state your conclusionFrom the sample statistics: x1=41, n1=100; x2=35, n2=140. Find the appropriate p-value used to test the hypothesis that the population proportions are equal using a significance level of 0.05. Note: Use four decimal places.